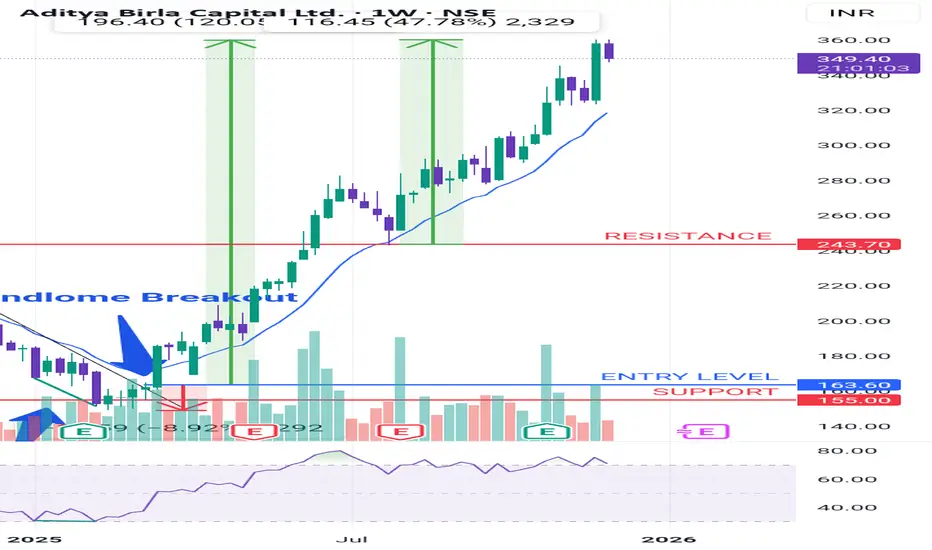
In weekly chart of ABCAPITAL there was RSI Divergence in first quarter of Year 2025. It made a Trendline Breakout in second week of March 2025
And gave entry above breakout candle weekly close at 163.6 and then with a risk of 9% it gave one sided returns of Risk:Reward of 1:13
Curent Return at 120%
It retested resistance level of 243.7 which corresponded 21-EMA in july 2025 and again gave return of 45% from the resistance level
It is again forming a Bearish RSI Divergence. But bullish trend is intact till it gives a weekly close below 21-EMA
Clause de non-responsabilité
Les informations et publications ne sont pas destinées à être, et ne constituent pas, des conseils ou recommandations financiers, d'investissement, de trading ou autres fournis ou approuvés par TradingView. Pour en savoir plus, consultez les Conditions d'utilisation.
Clause de non-responsabilité
Les informations et publications ne sont pas destinées à être, et ne constituent pas, des conseils ou recommandations financiers, d'investissement, de trading ou autres fournis ou approuvés par TradingView. Pour en savoir plus, consultez les Conditions d'utilisation.