Chart Breakdown
🟢 Pattern:
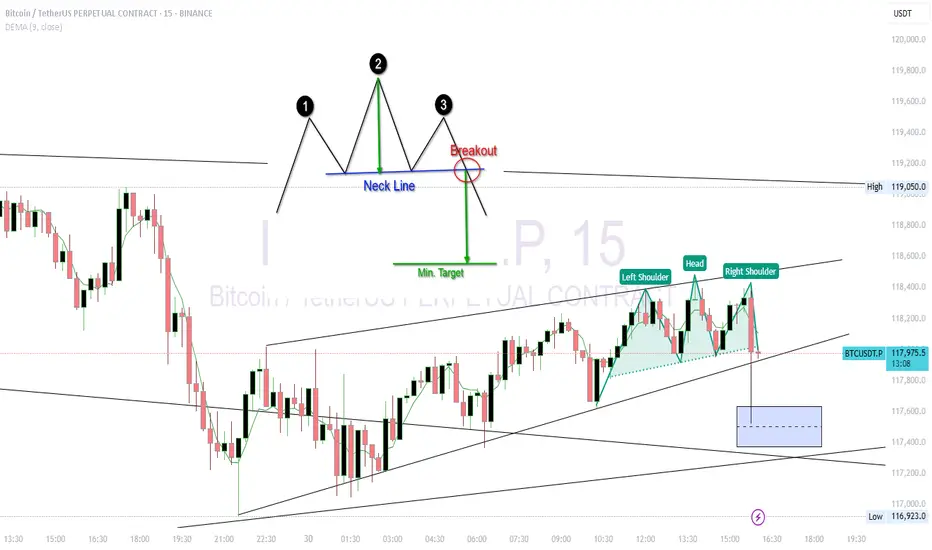
Left Shoulder: 118,450
Head: ~118,600
Right Shoulder: ~118,400
Neckline: Sloping slightly upward, around 118,050
📌 Bearish Breakdown Scenario
If BTC breaks below the neckline (~118,000) with volume, the expected drop (measured move) is:
Height of pattern:
Head (118,600) – Neckline (118,000) = 600 pts
Target on breakdown:
118,000 – 600 = ~117,400
🔻 Target: 117,400–117,300
🔒 Invalidation: Price closes above 118,300 with strong volume.
🟢 Pattern:
Left Shoulder: 118,450
Head: ~118,600
Right Shoulder: ~118,400
Neckline: Sloping slightly upward, around 118,050
📌 Bearish Breakdown Scenario
If BTC breaks below the neckline (~118,000) with volume, the expected drop (measured move) is:
Height of pattern:
Head (118,600) – Neckline (118,000) = 600 pts
Target on breakdown:
118,000 – 600 = ~117,400
🔻 Target: 117,400–117,300
🔒 Invalidation: Price closes above 118,300 with strong volume.
Clause de non-responsabilité
Les informations et publications ne sont pas destinées à être, et ne constituent pas, des conseils ou recommandations financiers, d'investissement, de trading ou autres fournis ou approuvés par TradingView. Pour en savoir plus, consultez les Conditions d'utilisation.
Clause de non-responsabilité
Les informations et publications ne sont pas destinées à être, et ne constituent pas, des conseils ou recommandations financiers, d'investissement, de trading ou autres fournis ou approuvés par TradingView. Pour en savoir plus, consultez les Conditions d'utilisation.