📅  DOT is at a crucial juncture, with major structure overlap across timeframes.
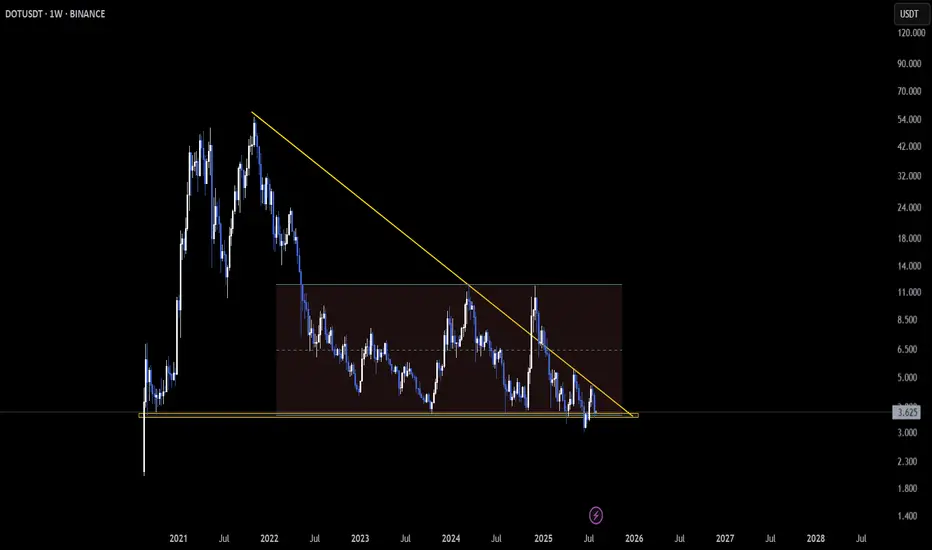
On the Weekly, price is testing support from a descending triangle 🛡️ — a level that has held multiple times in the past.
📆 Meanwhile, the Daily chart shows a falling wedge pattern forming 📐, a classic setup known for bullish reversals.
The confluence here adds weight — this is a zone where price often reacts.
👀 Bounce incoming or breakdown loading? This one deserves close attention.
What’s your take on the next move?
Not financial advice. DOTUSDT
On the Weekly, price is testing support from a descending triangle 🛡️ — a level that has held multiple times in the past.
📆 Meanwhile, the Daily chart shows a falling wedge pattern forming 📐, a classic setup known for bullish reversals.
The confluence here adds weight — this is a zone where price often reacts.
👀 Bounce incoming or breakdown loading? This one deserves close attention.
What’s your take on the next move?
Not financial advice.
I share more in my court
Join me on X: x.com/Coin_Mastermind
Join me on Telegram: t.me/coin_mastermind
Join me on X: x.com/Coin_Mastermind
Join me on Telegram: t.me/coin_mastermind
Clause de non-responsabilité
Les informations et publications ne sont pas destinées à être, et ne constituent pas, des conseils ou recommandations financiers, d'investissement, de trading ou autres fournis ou approuvés par TradingView. Pour en savoir plus, consultez les Conditions d'utilisation.