HCLTECH – Channel Bottom Support & Multiple Breakouts | Short-Term Bullish Setup
For Study Purpose Only
🕒 Timeframe: Weekly & Daily
💡 Pattern: Channel Support + Neckline/Trendline Breakout
📈 Current Zone: Near Channel Bottom
🎯 Bias: Short-Term Bullish
🧭 Technical View:
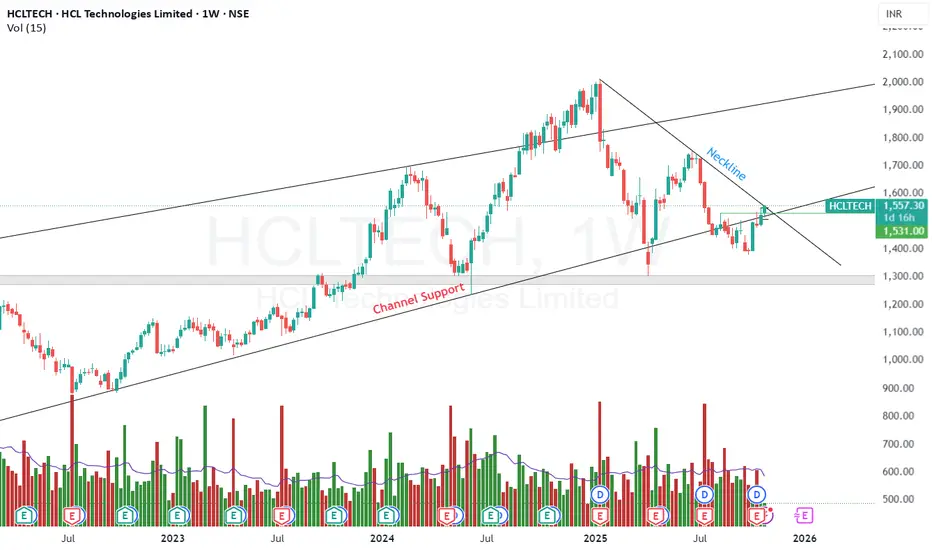
On the weekly chart, HCL Tech has taken strong support near the lower boundary of its ascending channel, indicating the continuation of the prevailing uptrend structure. A bullish reversal candle on the weekly timeframe further confirms buying interest at this crucial support zone.
On the daily chart, the price has given a decisive breakout above the neckline/trendline resistance, supported by a series of multiple inside bar breakouts, showing momentum buildup and strength in the short-term structure.
The stock is now trading above key moving averages, and with follow-through confirmation, it may continue its upward trajectory in the coming sessions.
📊 Study Highlights:
Weekly chart: strong rebound from channel bottom
Daily chart: neckline/trendline breakout confirmed
Multiple inside bar breakouts indicate strength
Weekly candle shows reversal formation
Short-term bullish momentum emerging
⚠️ Disclaimer:
This analysis is purely for educational and study purposes only. Not a buy/sell recommendation. Always conduct your own due diligence before taking any trading decision.
For Study Purpose Only
🕒 Timeframe: Weekly & Daily
💡 Pattern: Channel Support + Neckline/Trendline Breakout
📈 Current Zone: Near Channel Bottom
🎯 Bias: Short-Term Bullish
🧭 Technical View:
On the weekly chart, HCL Tech has taken strong support near the lower boundary of its ascending channel, indicating the continuation of the prevailing uptrend structure. A bullish reversal candle on the weekly timeframe further confirms buying interest at this crucial support zone.
On the daily chart, the price has given a decisive breakout above the neckline/trendline resistance, supported by a series of multiple inside bar breakouts, showing momentum buildup and strength in the short-term structure.
The stock is now trading above key moving averages, and with follow-through confirmation, it may continue its upward trajectory in the coming sessions.
📊 Study Highlights:
Weekly chart: strong rebound from channel bottom
Daily chart: neckline/trendline breakout confirmed
Multiple inside bar breakouts indicate strength
Weekly candle shows reversal formation
Short-term bullish momentum emerging
⚠️ Disclaimer:
This analysis is purely for educational and study purposes only. Not a buy/sell recommendation. Always conduct your own due diligence before taking any trading decision.
Clause de non-responsabilité
Les informations et les publications ne sont pas destinées à être, et ne constituent pas, des conseils ou des recommandations en matière de finance, d'investissement, de trading ou d'autres types de conseils fournis ou approuvés par TradingView. Pour en savoir plus, consultez les Conditions d'utilisation.