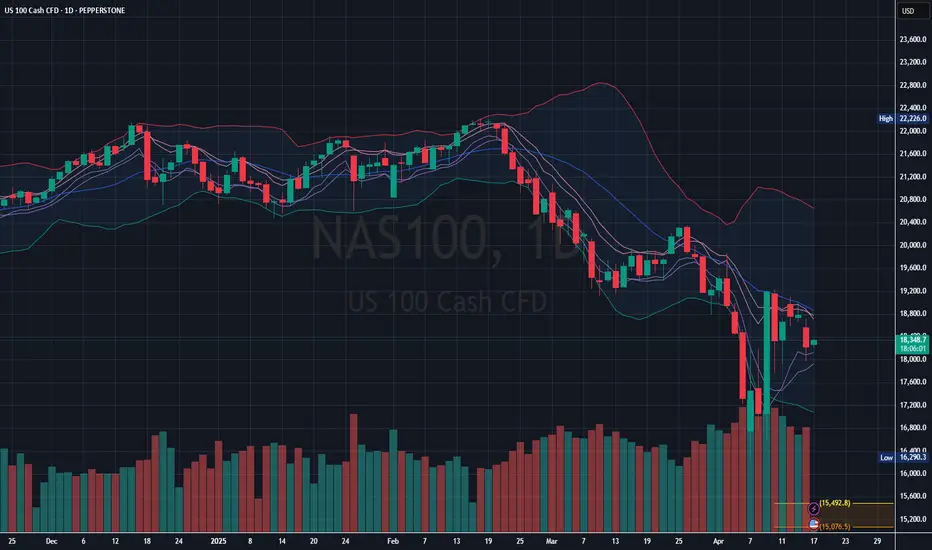
- Currently trading below the 20-day SMA (middle of Bollinger Bands), indicating bearish momentum.
- Support zone: ~17,600 (recent lows and high volume area)
- Resistance zone: ~18,800–19,200 (middle Bollinger Band & recent highs)
- Failure to break above 18,800 and another test of 17,600 could lead to continuation downward, possibly toward 17,000–16,800.
➀➁➂➃➄
Clause de non-responsabilité
Les informations et publications ne sont pas destinées à être, et ne constituent pas, des conseils ou recommandations financiers, d'investissement, de trading ou autres fournis ou approuvés par TradingView. Pour en savoir plus, consultez les Conditions d'utilisation.