Ticker: NFLX (Netflix, Inc.)
Timeframe: 2-hour
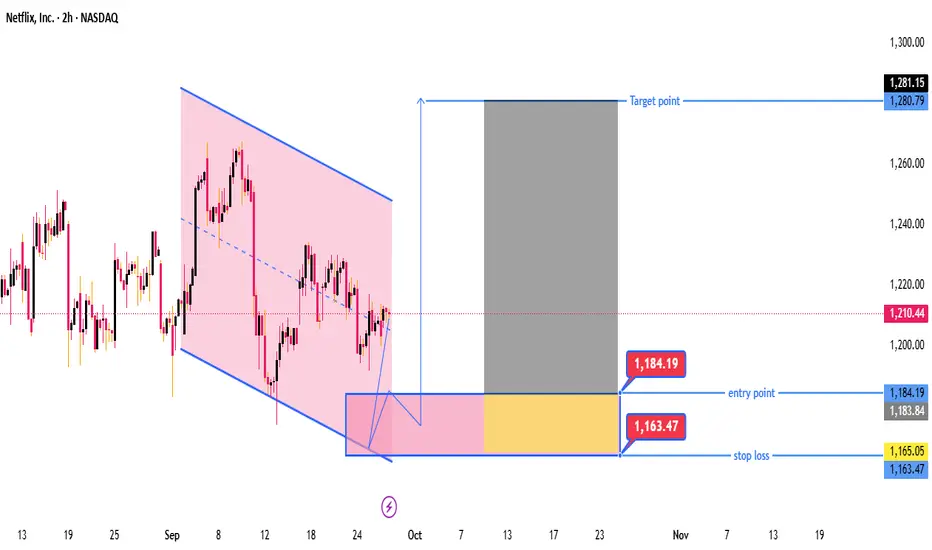
Current Price: $1,210.44
Trend: Price was moving in a downward channel (pink shaded area), but there's a potential breakout forming to the upside.
📉 Pattern Recognition
A falling channel is drawn (marked in pink).
The price appears to have broken out of this falling channel or is testing the breakout.
A bullish reversal is suggested, as there's a highlighted buy zone below the current price.
💡 Trade Setup
Element Value Description
Entry Point $1,184.19 Suggested buy zone
Stop Loss $1,163.47 Risk management level
Target Point $1,281.15 Projected upside target
🟨 Entry Zone
The blue box around $1,184.19 represents a demand zone (possible retracement buy area).
Yellow shaded area = refined zone of interest for buyers.
🟥 Stop Loss Zone
Stop loss below the demand zone, set at $1,163.47 (just below support structure).
Provides cushion against false breakouts.
🟦 Target Zone
Projected target at $1,281.15, aligned with previous resistance or measured move.
Expecting a trend continuation after the breakout.
⚖️ Risk-to-Reward Ratio (RRR)
Entry: $1,184.19
Stop: $1,163.47
Target: $1,281.15
Risk: $1,184.19 - $1,163.47 = $20.72
Reward: $1,281.15 - $1,184.19 = $96.96
📈 RRR ≈ 4.68:1 — very favorable.
🧠 Conclusion
This chart suggests a bullish breakout trade setup on Netflix.
The trade is designed to capitalize on the breakout from a downward channel.
High risk-to-reward setup.
Wait for price action confirmation in the entry zone before initiating a trade.
Watch for volume and overall market sentiment to confirm the breakout strength.
Timeframe: 2-hour
Current Price: $1,210.44
Trend: Price was moving in a downward channel (pink shaded area), but there's a potential breakout forming to the upside.
📉 Pattern Recognition
A falling channel is drawn (marked in pink).
The price appears to have broken out of this falling channel or is testing the breakout.
A bullish reversal is suggested, as there's a highlighted buy zone below the current price.
💡 Trade Setup
Element Value Description
Entry Point $1,184.19 Suggested buy zone
Stop Loss $1,163.47 Risk management level
Target Point $1,281.15 Projected upside target
🟨 Entry Zone
The blue box around $1,184.19 represents a demand zone (possible retracement buy area).
Yellow shaded area = refined zone of interest for buyers.
🟥 Stop Loss Zone
Stop loss below the demand zone, set at $1,163.47 (just below support structure).
Provides cushion against false breakouts.
🟦 Target Zone
Projected target at $1,281.15, aligned with previous resistance or measured move.
Expecting a trend continuation after the breakout.
⚖️ Risk-to-Reward Ratio (RRR)
Entry: $1,184.19
Stop: $1,163.47
Target: $1,281.15
Risk: $1,184.19 - $1,163.47 = $20.72
Reward: $1,281.15 - $1,184.19 = $96.96
📈 RRR ≈ 4.68:1 — very favorable.
🧠 Conclusion
This chart suggests a bullish breakout trade setup on Netflix.
The trade is designed to capitalize on the breakout from a downward channel.
High risk-to-reward setup.
Wait for price action confirmation in the entry zone before initiating a trade.
Watch for volume and overall market sentiment to confirm the breakout strength.
join my telegram channel t.me/goldmitalteam
t.me/goldmitalteam
t.me/goldmitalteam
Clause de non-responsabilité
Les informations et publications ne sont pas destinées à être, et ne constituent pas, des conseils ou recommandations financiers, d'investissement, de trading ou autres fournis ou approuvés par TradingView. Pour en savoir plus, consultez les Conditions d'utilisation.