📊 Key levels & structure
Based on current weekly chart readings, recent pivot data and visible support/resistance zones:
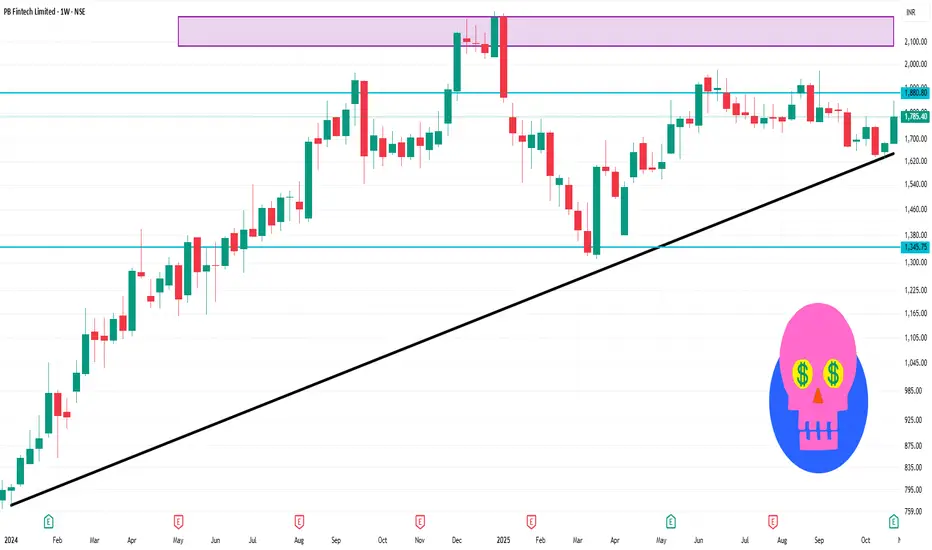
Resistance zone: ~ ₹1,775-1,825 — price has been tested around this area, acting as a cap.
Support zone: ~ ₹1,650-1,620 — key lower bounds that have held in recent pullbacks.
Intermediate pivot / trigger area: ~ ₹1,700-₹1,740 — if this area gives way, next leg down could accelerate; if it holds, potential bounce.
Weekly trend: The stock is below its 50- and 200-week moving averages, signalling caution for bulls.
Momentum: RSI in mid‐range, ADX weak, so trend strength is moderate.
Based on current weekly chart readings, recent pivot data and visible support/resistance zones:
Resistance zone: ~ ₹1,775-1,825 — price has been tested around this area, acting as a cap.
Support zone: ~ ₹1,650-1,620 — key lower bounds that have held in recent pullbacks.
Intermediate pivot / trigger area: ~ ₹1,700-₹1,740 — if this area gives way, next leg down could accelerate; if it holds, potential bounce.
Weekly trend: The stock is below its 50- and 200-week moving averages, signalling caution for bulls.
Momentum: RSI in mid‐range, ADX weak, so trend strength is moderate.
Publications connexes
Clause de non-responsabilité
Les informations et publications ne sont pas destinées à être, et ne constituent pas, des conseils ou recommandations financiers, d'investissement, de trading ou autres fournis ou approuvés par TradingView. Pour en savoir plus, consultez les Conditions d'utilisation.