Based on the charts and the market's performance on Tuesday, October 14, the Sensex experienced a sharp pullback from its high, confirming strong selling pressure and a Market Structure Shift (MSS) to the downside.
Detailed Market Structure Breakdown
4-Hour Chart (Macro Trend)
Structure: The Sensex has confirmed a strong short-term corrective phase. The price failed to sustain the move above the 82,300 resistance and broke below the lower trendline of its short-term ascending channel. The strong red candle confirms bears are back in control, pushing the price toward the major support area.
Key Levels:
Major Supply (Resistance): 82,200 - 82,400. This area is the critical overhead supply zone (Order Block) and the high of the recent swing.
Major Demand (Support): 81,600 - 81,800. This area is the key FVG (Fair Value Gap) and the new must-hold zone for the current uptrend. Breaking this level would signal a deeper correction.
Outlook: The short-term bias is sideways-to-bearish. The market is expected to test the 81,600 - 81,800 support zone.
1-Hour Chart (Intermediate View)
Structure: The 1H chart shows a clear Break of Structure (BOS) to the downside. The price is now trading within a descending channel, having broken the immediate swing low. The current price is right on the 9-period EMA, suggesting a temporary bounce is possible before further selling.
Key Levels:
Immediate Resistance: 82,200 (Upper trendline of the descending channel).
Immediate Support: 81,800 (Lower boundary of the current corrective channel).
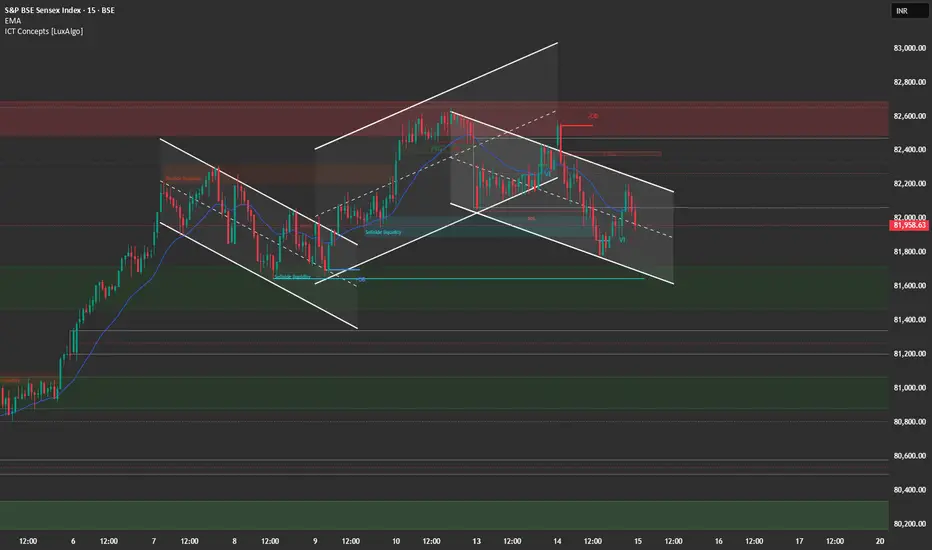
15-Minute Chart (Intraday View)
Structure: The 15M chart confirms the sharp selling pressure. The market broke down from the 82,300 level and is now forming a descending channel. The late-day selling (marked by the red candles) indicates bears were dominant.
Key Levels:
Intraday Supply: 82,200.
Intraday Demand: 81,800.
Outlook: Bearish. A "Sell on Rise" strategy is recommended near 82,000 - 82,200.
📈 Trade Plan (Wednesday, 15th October)
Market Outlook: The Sensex is undergoing a sharp short-term correction. The primary strategy will be to sell into strength or on a breakdown of immediate support. Tech Mahindra and Persistent Systems Q2 results are due today, which may provide sector-specific volatility.
Bearish Scenario (Primary Plan)
Justification: The breakdown of the channel and the strong rejection from the highs favor continuation of the correction.
Entry: Short entry on a successful retest and rejection of the 82,200 level (upper channel resistance/FVG). Alternatively, short a decisive break and 15-minute candle close below 81,800.
Stop Loss (SL): Place a stop loss above 82,400 (above the immediate swing high/supply zone).
Targets:
T1: 81,600 (Major FVG support).
T2: 81,200 (Next major support).
Bullish Scenario (Counter-Trend/Reversal Plan)
Justification: Only valid if Q2 results provide a strong positive surprise, leading to a move that negates the current selling pressure.
Trigger: A sustained move and close above the resistance at 82,400.
Entry: Long entry on a confirmed 15-minute close above 82,400.
Stop Loss (SL): Below 82,100.
Targets:
T1: 82,600 (Upper resistance).
T2: 82,900 (Extension target).
Key Levels for Observation:
Immediate Decision Point: 81,800 - 82,200 zone.
Bearish Confirmation: A break and sustained move below 81,800.
Bullish Confirmation: A move back above 82,400.
Line in the Sand: 81,800. Below this level, the short-term bullish bias is nullified.
Clause de non-responsabilité
Les informations et publications ne sont pas destinées à être, et ne constituent pas, des conseils ou recommandations financiers, d'investissement, de trading ou autres fournis ou approuvés par TradingView. Pour en savoir plus, consultez les Conditions d'utilisation.
Clause de non-responsabilité
Les informations et publications ne sont pas destinées à être, et ne constituent pas, des conseils ou recommandations financiers, d'investissement, de trading ou autres fournis ou approuvés par TradingView. Pour en savoir plus, consultez les Conditions d'utilisation.