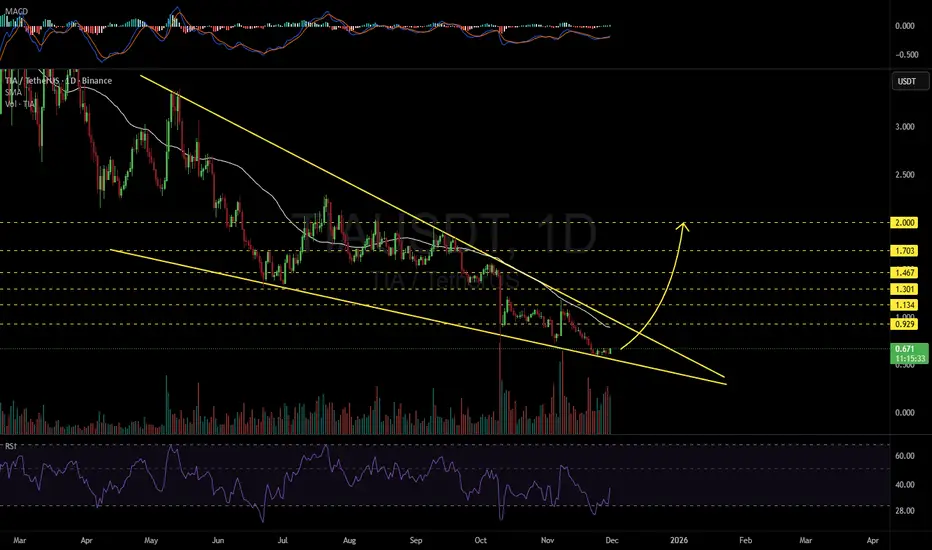
#TIA may be aiming for the $2 level.
#TIA is moving inside a falling wedge pattern on the daily chart and has bounced off the wedge support. In case of a breakout above the wedge resistance and the daily SMA50, the targets are:
🎯 $0.929
🎯 $1.134
🎯 $1.301
🎯 $1.467
🎯 $1.703
🎯 $2.000
⚠️ Always remember to use a tight stop-loss and maintain proper risk management.
Clause de non-responsabilité
Les informations et publications ne sont pas destinées à être, et ne constituent pas, des conseils ou recommandations financiers, d'investissement, de trading ou autres fournis ou approuvés par TradingView. Pour en savoir plus, consultez les Conditions d'utilisation.
Clause de non-responsabilité
Les informations et publications ne sont pas destinées à être, et ne constituent pas, des conseils ou recommandations financiers, d'investissement, de trading ou autres fournis ou approuvés par TradingView. Pour en savoir plus, consultez les Conditions d'utilisation.