[JR] Multi Bollinger Heat Bands - EMA/Breakout options
A little, yet hopefully useful update over my previous "Multi Bollinger Heat Bands". For those who like quick visual cue's.
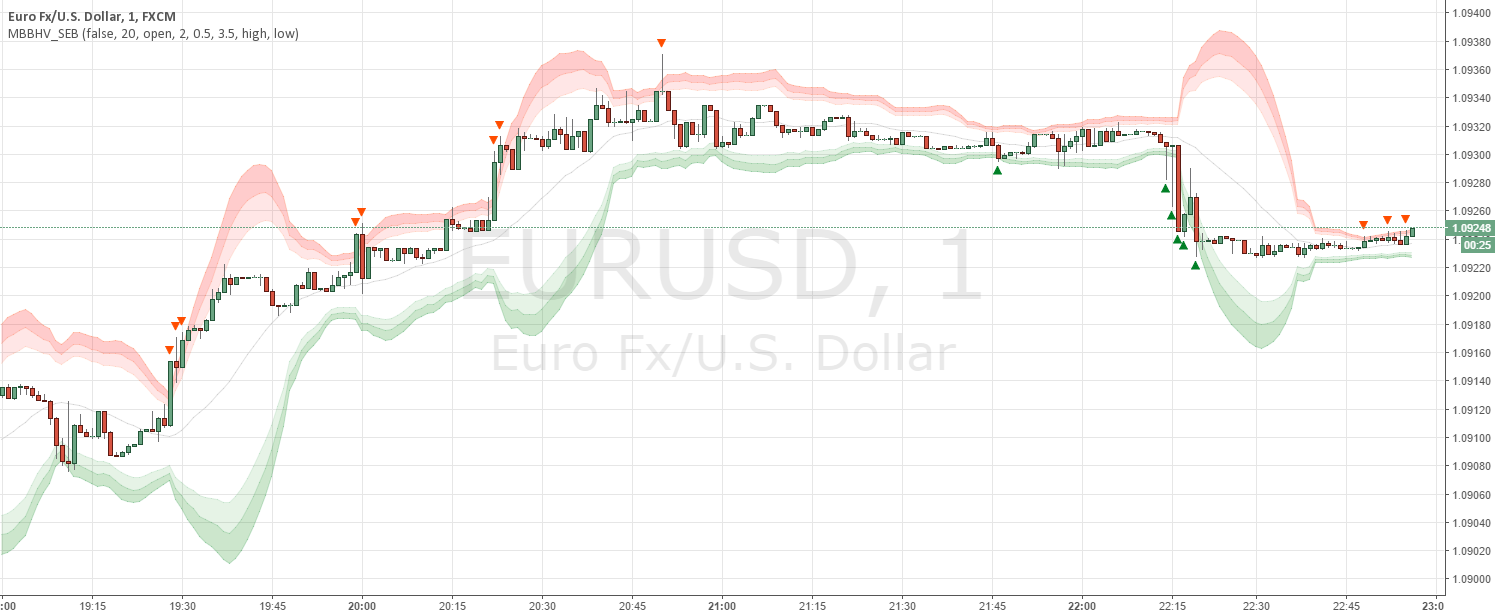
In short: It's your Basic Bollinger Bands, but 3 of them, and some pointy things.
In full:
In short: It's your Basic Bollinger Bands, but 3 of them, and some pointy things.
In full:
- Three stacked SMA based Bollinger Bands designed just to give you a quick visual on the "heat" of movement.
- Set inner band as you would expect, then set your preferred additional multiplier increments for the outer 2 bands.
- Option to use EMA as alternative basis, rather than SMA.
- Breakout indication shapes, which have their own multiplier (but still tied to same length/period as the BB's) so you can make them pop on their own separate "band".
Commentaire:
New iteration of this script here:

// @version=1

// Title: "Multi Bollinger Heat Bands - EMA/Breakout options".
// Author: JayRogers
//
// * Description *
//   Short: It's your Basic Bollinger Bands, but 3 of them, and some pointy things.
//
//   Long:  Three stacked sma based Bollinger Bands designed just to give you a quick visual on the "heat" of movement.
//          Set inner band as you would expect, then set your preferred additional multiplier increments for the outer 2 bands.
//          Option to use EMA as alternative basis, rather than SMA.
//          Breakout indication shapes, which have their own multiplier seperate from the BB's; but still tied to same length/period.

study(shorttitle="[JR]MBHB_EBO", title="[JR] Multi Bollinger Heat Bands - EMA/Breakout options", overlay=true)

// Bollinger Bands Inputs
bb_use_ema = input(false, title="Use EMA Basis?")
bb_length = input(20, minval=1, title="Bollinger Length")
bb_source = input(close, title="Bollinger Source")
bb_mult = input(2.0, title="Base Multiplier", minval=0.001, maxval=50)
bb_mult_inc = input(0.5, title="Multiplier Increment", minval=0.001, maxval=2)
// Breakout Indicator Inputs
break_mult = input(2.7, title="Breakout Multiplier", minval=0.001, maxval=50)
breakhigh_source = input(high, title="High Break Source")
breaklow_source = input(low, title="Low Break Source")

bb_basis = bb_use_ema ? ema(bb_source, bb_length) : sma(bb_source, bb_length)

// Deviation
// * I'm sure there's a way I could write some of this cleaner, but meh.
dev = stdev(bb_source, bb_length)
bb_dev_inner = bb_mult * dev
bb_dev_mid = (bb_mult + bb_mult_inc) * dev
bb_dev_outer = (bb_mult + (bb_mult_inc * 2)) * dev
break_dev = break_mult * dev

// Upper bands
inner_high = bb_basis + bb_dev_inner
mid_high = bb_basis + bb_dev_mid
outer_high = bb_basis + bb_dev_outer
// Lower Bands
inner_low = bb_basis - bb_dev_inner
mid_low = bb_basis - bb_dev_mid
outer_low = bb_basis - bb_dev_outer

// Breakout Deviation
break_high = bb_basis + break_dev
break_low = bb_basis - break_dev

// plot basis
plot(bb_basis, title="Basis Line", color=navy, transp=50)

// plot and fill upper bands
ubi = plot(inner_high, title="Upper Band Inner", color=red, transp=90)
ubm = plot(mid_high, title="Upper Band Middle", color=red, transp=85)
ubo = plot(outer_high, title="Upper Band Outer", color=red, transp=80)
fill(ubi, ubm, title="Upper Bands Inner Fill", color=red, transp=90)
fill(ubm, ubo, title="Upper Bands Outer Fill",color=red, transp=80)

// plot and fill lower bands
lbi = plot(inner_low, title="Lower Band Inner", color=green, transp=90)
lbm = plot(mid_low, title="Lower Band Middle", color=green, transp=85)
lbo = plot(outer_low, title="Lower Band Outer", color=green, transp=80)
fill(lbi, lbm, title="Lower Bands Inner Fill", color=green, transp=90)
fill(lbm, lbo, title="Lower Bands Outer Fill", color=green, transp=80)

// center channel fill
fill(ubi, lbi, title="Center Channel Fill", color=silver, transp=100)

// plot breakouts
plotshape(breakhigh_source >= break_high, title="High Breakout", style=shape.triangledown, location=location.abovebar, size=size.tiny, color=red, transp=0)
plotshape(breaklow_source <= break_low, title="Low Breakout", style=shape.triangleup, location=location.belowbar, size=size.tiny, color=green, transp=0)