Indicateur
Alltimehigh

52-Week High DiamondMarks every bar that made a new 52-week high with a small diamond above the wick. The most recent 52-week high is highlighted in full color so it stands out at a glance. All prior highs display at reduced opacity to keep the chart clean without losing the historical context.
Useful for quickly identifying where a stock has been making new highs, how frequently it's been doing so, and how far back the most recent high occurred — all without cluttering your chart.
Settings
Toggle all histori
Indicateur

Puma Base IndicatorUn indicador que tiene Zero, all time high y tambien cuanto ha caido desde el ultimo ATH
Indicateur

Blue Sky (All-Time High) HUDBlue Sky at a Glance
Blue Sky (All-Time High) HUD is a fixed, price-overlay indicator designed to instantly show a stock’s highest price achieved within the loaded chart history, without requiring you to zoom out or scan manually.
Instead of drawing cluttered historical markers, this script calculates the running all-time high and displays it in a clean, fixed HUD anchored to the top-right of the chart.
How It Works
The script continuously tracks the highest high reached on the chart and upd
Indicateur

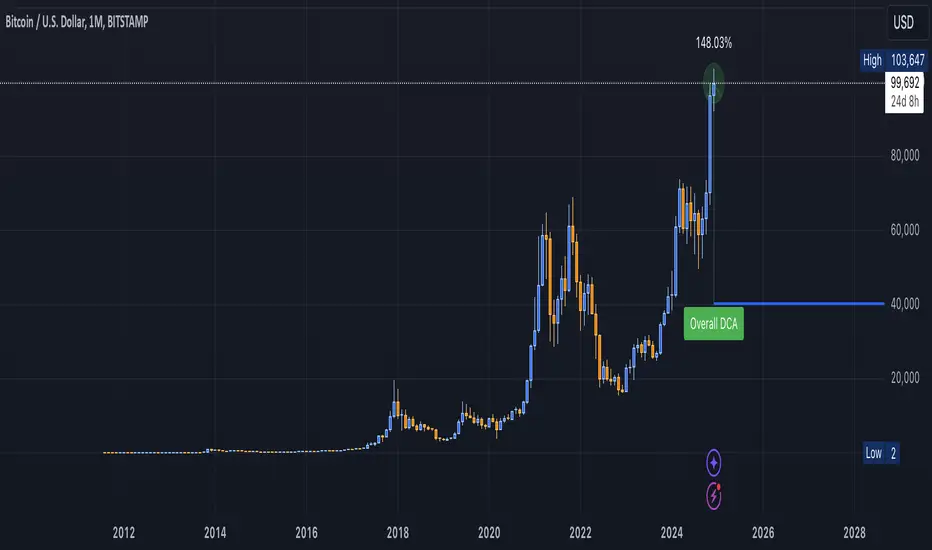
DCA Valuation & Unrealized GainsThis Pine Script for TradingView calculates and visualizes the relationship between a Dollar Cost Average (DCA) price and the All-Time High (ATH) price for over 50 different cryptocurrencies. Here's what it does:
1. Inputs for DCA Prices:
- Users can manually input DCA prices for specific cryptocurrencies (e.g., BTC, ETH, BNB).
2. Dynamic ATH Calculation:
- Dynamically calculates the ATH price for the current asset using the highest price in the chart's loaded data and persists this valu
Indicateur
ATH/ATL Tracker [LuxAlgo]The ATH/ATL Tracker effectively displays changes made between new All-Time Highs (ATH)/All-Time Lows (ATL) and their previous respective values, over the entire history of available data.
The indicator shows a histogram of the change between a new ATH/ATL and its respective preceding ATH/ATL. A tooltip showing the price made during a new ATH/ATL alongside its date is included.
🔶 USAGE
By tracking the change between new ATHs/ATLs and older ATHs/ATLs, traders can gain insight into marke
Indicateur

ATH Distance HeatmapThe "ATH Distance Heatmap" is a powerful visualization tool designed for traders and investors who seek to quickly assess the relative performance of assets against their All-Time Highs (ATH). By mapping the percentage distance of current prices from their historical peaks, this script provides a unique perspective on market sentiment, potential recovery opportunities, and overvaluation risks.
Key Features:
Visual Clarity: Utilize a color-coded heatmap to instantly recognize which assets a
Indicateur

All Time High (ATH) Levels [LuxAlgo]The All Time High (ATH) Levels indicator displays a user-set amount of historical all-time high levels made on the user's chart, highlighting potential key price levels.
Displayed levels can be filtered out based on their duration, as well as their relative distance from each other.
The script also evaluates the role a level might have as a support or resistance using a percentage, classifying ATH levels as either support or resistance depending on the result.
🔶 USAGE
On certain assets
Indicateur

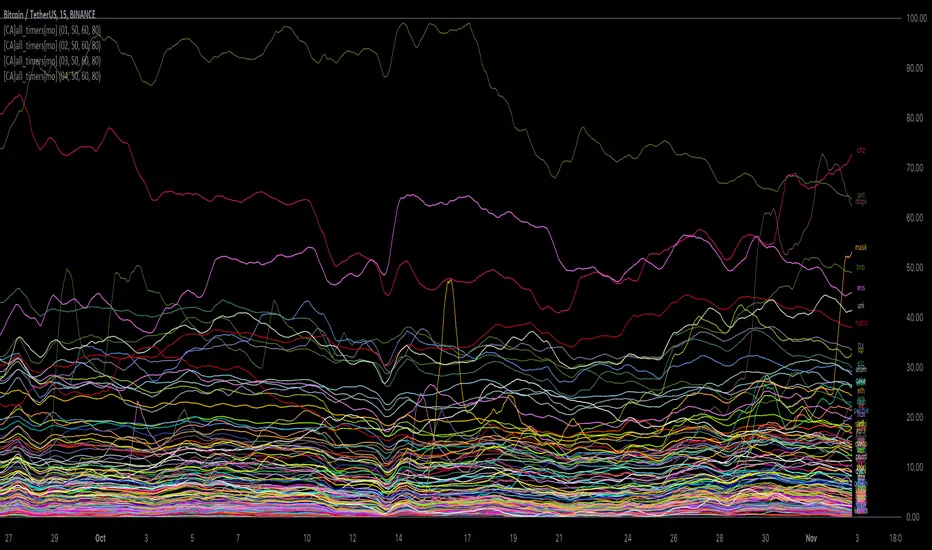
[ChasinAlts] All-Timers [MO]*** PLEASE NOTE: THIS SCRIPT WILL MAKE TV's SERVERS FLEX IT'S MUSCLES SO IT WILL SLOW DOWN OTHER PROCESSES WITHIN TV (HIDE THEM IF NECESSARY TO REGAIN THE SPEED/FUNCTION...OR DELETE THEM...WHAT DO I CARE???) ESP IF YOU HAVE 3-4 ITERATIONS AS I DO TO SHOW THE WHOLE KUCOIN MARGIN MARKET ***
G'day Tradeurs, Hope everyone is having a FAN-FRIGGIN-TASTIC DAY!!! Right now (November 2nd, 2022) is a GREAT time to look for coins that are near their ALL-Time Low
due to the incoming bull market rearing its
Indicateur
Percent Off All-time High (% Off High)Percent Off All-time High tracks the percentage difference between the previous day’s closing price and the All-Time high price of the security’s entire price history.
This metric tells you how far the price has deviated from/converged on the all-time high price.
Indicateur

All-Time High with Percentage Drops for ETF's and Large CapsPlots the percentage drop levels from the All-Time High of any ticker. You can use this within a pullback trading system. For example, if you historically look at the average pullback of large cap stocks and ETF's, you can use this indicator to plot the levels it could pullback to for an entry to go long. It can be used as potential targets when trading a ticker short. Another use for this is to backtest the set percentage targets using TradingView's bar replay feature to see how ETF's and large
Indicateur

All-Time High/Low WidgetIt's a pretty simple widget to track all-time high and all-time low values.
You can plot the levels and display some stats when all-time happened and how far away are we at this moment.
Also, you can create alerts to get notified on ATH/ATL breakout.
Thanks to @Verleiht for helping me with the code.
Disclaimer
Please remember that past performance may not be indicative of future results.
Due to various factors, including changing market conditions, the strategy may no longer perform as w

Indicateur

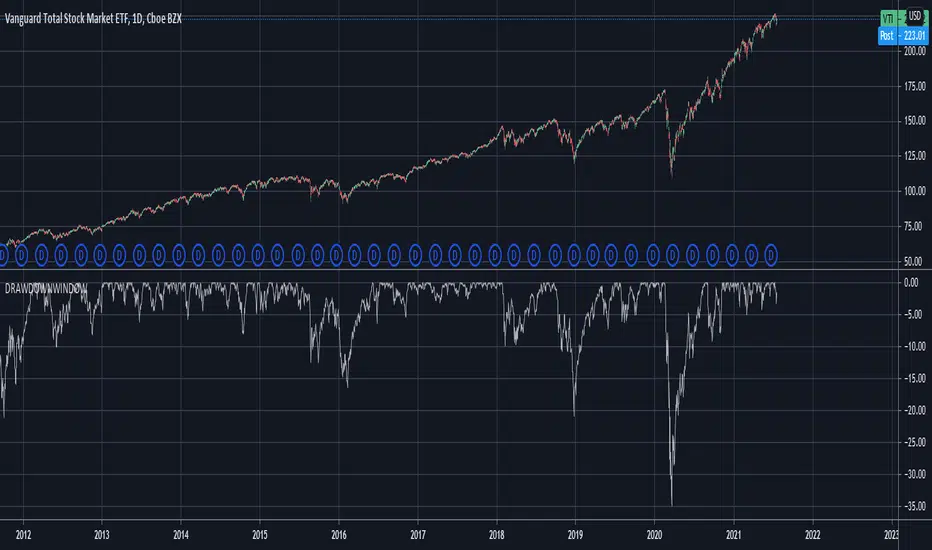
Drawdown over Window (in percentage)Unlike other scripts, which compare against the all time high, this allows you to specify the window over which the high should be searched.
If you want to compare against the all time high, just choose a long enough window.
Indicateur
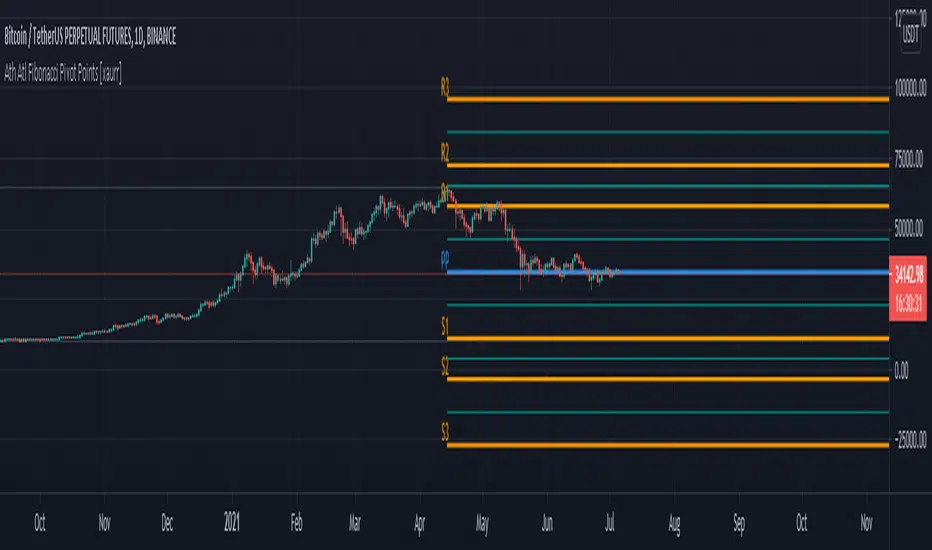
Ath Atl Fibonacci Pivot Points [xaurr]This script draws fibonacci support and ressistance lines according to all time high and low values.
Indicateur
Distance from the ATH priceThis indicator shows us the distance (in %) between the current price and the ATH price.
The closer the price is to the ATH the higher the percentage.
100% means we reached the ATH price.
HOW TO USE:
No special input necessary.
Markets:
It can be used to all markets.
NOTE:
Some Exchanges don't go very far back in the past and for this reason this may have impact on this Indicator.
Indicateur

ALL TIME HIGH/LOW AND 52 WEEKS HIGH/LOWThis script show:
1. All time high/low line shown in maroon color
2. 52weeks high/low line shown in red color
3. 25% below 52wh and 30% upper 52wl as per Mark Minervini suggset in his book "Trade Like a Stock Market Wizard: How to Achieve Super Performance in Stocks in Any
Market"
Thats all, hope benefit tou you all.
Thank you.
Indicateur

inwCoin Percent from all-time highSimple study to show the fact to some newbies in the market that it is VERY HARD to make a profit and get your portfolio back to all-time high if you don't know how to stop loss...
Some people think "Oh, ez if you down -90% you need only +90% to get 100% of your capital again"
But... actually....if your portfolio down -90% you need to go 1000% from current price to reach your start capital!!!!
This study will show
- Current symbol detail
- Percent down from All-time High ( ATH )
- Percent u
Indicateur

Indicateur

10/20 MA Cross-Over with Heikin-Ashi Signals by SchobbejakThe 10/20 MA Heikin-Ashi Strategy is the best I know. It's easy, it's elegant, it's effective.
It's particularly effective in markets that trend on the daily. You may lose some money when markets are choppy, but your loss will be more than compensated when you're aboard during the big moves at the beginning of a trend or after retraces. There's that, and you nearly eliminate the risk of losing your profit in the long run.
The results are good throughout most assets, and at their best when an
Indicateur
