Cumulative Volume Delta CandlesCVD Trend Candles
Visualize buying and selling pressure directly on your price candles. This indicator colors your candlesticks based on Cumulative Volume Delta (CVD), helping you see the underlying order flow driving price action.
WHAT IS CVD?
Cumulative Volume Delta estimates the difference between aggressive buying and selling volume on each bar. Positive delta indicates more aggressive buying; negative delta indicates more aggressive selling.
COLOR METHODS
▸ CVD Raw
The simplest view—candles are colored based purely on the raw delta of each bar.
• Cyan = Positive delta (net buying)
• Red = Negative delta (net selling)
▸ Rule-Based (Default)
Uses Heikin Ashi-smoothed CVD candles with intensity based on trend strength:
• Bright colors = Strong conviction (larger body + continuation)
• Medium colors = Moderate conviction (continuation)
• Dark colors = Weak/indecision (inside candles, hesitation)
▸ Size-Based
Colors intensity based on z-score of delta changes:
• Bright colors = Statistically significant delta (above strong threshold)
• Medium colors = Moderate delta (above moderate threshold)
• Dark colors = Normal/quiet delta
KEY FEATURES
◆ Kalman Filter Smoothing
Adaptive filtering reduces noise while staying responsive to genuine shifts in order flow. Adjust sensitivity with the Responsiveness and Kalman Gain settings.
◆ Inside Candle Rule
When enabled, prevents false signals from inside candles that show a direction change but lack conviction. The candle retains the previous trend's color (dimmed) instead of flipping.
◆ Session Anchoring
Optionally reset cumulative delta at a specific time (e.g., market open) for intraday analysis.
◆ Z-Score Thresholds
Fine-tune what constitutes "strong" vs "moderate" delta activity for Size-Based coloring.
HOW TO USE
1. Add the indicator to your chart
2. Set your chart type to "Line" or bring the indicator to front via Visual Order → Bring to Front
3. Select your preferred Color Method
4. Look for:
• Sequences of bright cyan candles → Strong buying pressure / bullish momentum
• Sequences of bright red candles → Strong selling pressure / bearish momentum
• Fading colors → Weakening conviction, potential reversal or consolidation
• Color flips → Shift in order flow dominance
Notes
• This indicator estimates delta from OHLCV data. For true order flow analysis, consider using tick or trade data from your broker/exchange.
• Works on all timeframes and instruments with volume data.
• Best used in conjunction with support/resistance levels, market structure, or other confluence factors.
Recherche dans les scripts pour "VOLUME DELTA"

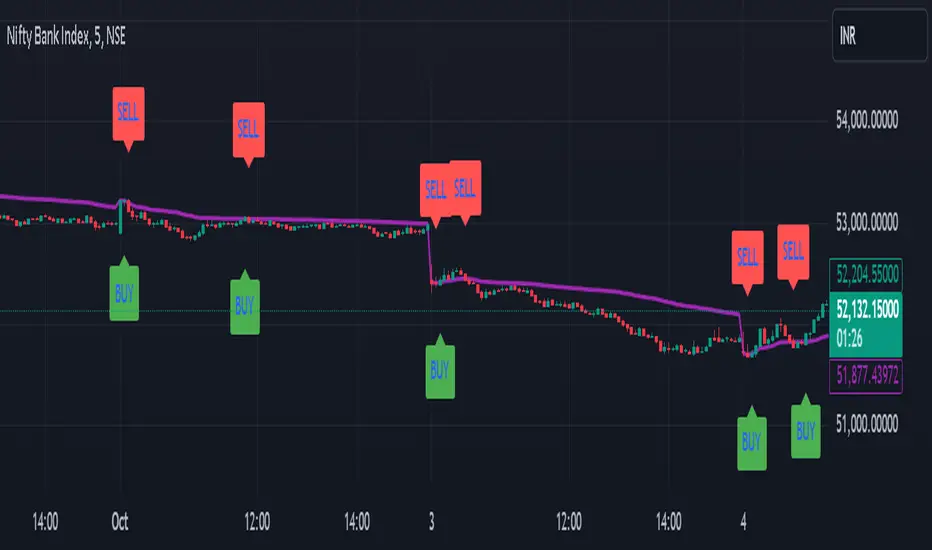
Cumulative Volume Delta with VWAP-based Buy/Sell AlertsDescription:
This script combines Cumulative Volume Delta (CVD) with Volume Weighted Average Price (VWAP) to generate buy and sell signals. It plots both the cumulative volume delta and its moving average on the chart, but the actual buy and sell signals are now based on the crossover and crossunder of the price with the VWAP, a popular tool for tracking price relative to the volume-weighted average over time.
Features:
Cumulative Volume Delta (CVD) Plot:
CVD helps visualize the net buying or selling pressure by accumulating volume when the price is rising and subtracting it when the price is falling. The cumulative volume is plotted on the chart as a blue line.
Moving Average of CVD:
A simple moving average (SMA) of the cumulative volume delta is plotted in orange to smooth out fluctuations and help detect the trend of volume flow.
VWAP Calculation:
VWAP (Volume Weighted Average Price) is a standard benchmark widely used in trading. It gives insight into whether the price is trading above or below the average price at which most of the volume has traded, weighted by volume. The VWAP is plotted as a purple line on the chart.
Buy/Sell Signals Based on VWAP:
Buy Signal: Triggered when the price crosses above the VWAP, indicating potential upward momentum.
Sell Signal: Triggered when the price crosses below the VWAP, signaling potential downward momentum.
These signals are displayed on the chart with clear labels:
Buy Signal: A green upward label appears below the price.
Sell Signal: A red downward label appears above the price.
Alerts for Buy/Sell Conditions:
Alerts are built into the script, so traders can receive notifications when the following conditions are met:
Buy Alert: The price crosses above the VWAP.
Sell Alert: The price crosses below the VWAP.
Use Case:
This script is useful for traders looking to incorporate both volume-based indicators and the VWAP into their trading strategy. The combination of CVD and VWAP provides a more comprehensive view of both price and volume dynamics:
VWAP helps traders understand whether the price is trading above or below its volume-weighted average.
CVD highlights buying or selling pressure through cumulative volume analysis.
Customization:
Anchor Periods: The user can customize the anchor period to suit different timeframes and trading styles.
Custom Alerts: The alert conditions can be easily modified to integrate into any trader’s strategy.
This script can be adapted for both short-term and long-term trading strategies and is especially useful in high-volume markets.
How to Use:
Add the script to your TradingView chart.
Customize the timeframe and anchor period, if needed, to match your preferred trading style.
Watch for Buy/Sell signals based on price crossing the VWAP.
Set up alerts to receive notifications when Buy or Sell signals are triggered.
This script is designed to help traders make informed decisions based on both price action relative to volume and Cumulative Delta volume trends, giving a more comprehensive view of the market dynamics.
Low Volatility Profiles [BigBeluga]🔵 OVERVIEW
Low Volatility Profiles is a market compression and breakout-anticipation tool that identifies phases of low volatility using ADX and then builds a real-time volume profile inside the detected range.
This helps traders spot accumulation/distribution zones and prepare for explosive moves when volatility expands.
When volatility is low ➜ price coils ➜ volume organizes ➜ breakouts become highly actionable.
This tool visualizes that process with dynamic range boxes + volume bins + PoC extension.
🔵 CONCEPTS
Low-Volatility Detection — Uses ADX threshold & cross logic to define volatility contraction regimes.
Range Construction — Draws a price box that expands with highs/lows during the compression phase.
Micro Volume Profile — Builds a volume histogram inside the range using bins (micro volume nodes).
Delta Calculation — Tracks positive vs negative volume to gauge buyer/seller pressure within range.
Point of Control (PoC) — Highlights the price level with max traded volume inside the range.
PoC Extension — Optionally extends PoC into future bars to show potential reaction zone after breakout.
Breakout Validation — Ends the profile zone when price breaks above or below the modeled range.
Noise Removal — Automatically removes invalid or small ranges to prevent chart clutter.
This tool turns consolidation into actionable structure by exposing where smart money accumulates before trending moves.
🔵 FEATURES
ADX-Driven Range Detection — Identify when market transitions into low-volatility compression.
Configurable ADX Threshold — Set sensitivity for contraction zones.
Cross-Type Option — Detect low volatility via cross under / crossover logic.
Dynamic Range Box — Expands live with price as contraction unfolds.
Micro Volume Profile (Bins) — Distributes volume across bins inside range for micro POC mapping.
Volume Delta Visualization — Shows imbalance inside consolidation (accumulation vs distribution).
Real-Time PoC Highlight — Instantly shows most traded price inside the compression.
PoC Extension Mode — Extend PoC forward to project reaction levels post-breakout.
Clean Auto-Reset Logic — Removes boxes if range invalid or breakout occurs too fast.
Optional Filled Boxes — Heatmap-style profile visualization inside range body.
ADX Line + Threshold Plot — Visual assistance for volatility state monitoring.
🔵 HOW TO USE
Identify Accumulation Zones — When price enters low-volatility ADX condition and profile builds.
Watch the PoC — PoC acts as battle zone; move above/below can signal initiator strength.
Breakout Strategy — Trade break above/below the range after compression.
Mean Reversion Inside Range — Fade edges while price remains inside compression box.
Combine With Trend Tools — Use trend confirmation (MA/EMA/Flow indicators) after breakout.
Use Delta Clues — Positive delta tilt suggests accumulation; negative suggests distribution.
Monitor Range Size — Longer build + high PoC volume = stronger potential breakout energy.
🔵 CONCLUSION
Low Volatility Profiles isolates accumulation phases and maps volume concentration before volatility expansion.
By combining ADX compression, micro volume distribution, and PoC tracing, traders gain an edge in anticipating powerful breakout cycles and institutional positioning.
Trade the quiet moment before the storm — where smart money prepares the move, and the real opportunity emerges.

Heikin-Ashi Cumulative Volume Delta (CVD)Heikin-Ashi Cumulative Volume Delta (CVD)
This indicator combines Heikin-Ashi calculations with a Cumulative Volume Delta (CVD) to highlight trends in volume.
🔹 Heikin-Ashi Calculation – Smooths out price action to filter noise and provide a clearer trend signal.
🔹 Adjusted Volume Delta – Uses a dynamic threshold based on 10 SMA to reduce sensitivity and eliminate minor fluctuations, showing only meaningful shifts in buying and selling pressure.
🔹 Cumulative Volume Delta (CVD) – Accumulates positive or negative volume depending on Heikin-Ashi candle direction, offering insight into underlying order flow.
🔹 EMA Trend Filters – Two user-adjustable EMAs (default: 20 & 50) applied to CVD, color-coded to indicate trend bias (green/red for short EMA, blue/orange for long EMA).
🔹 Visual Enhancements –
CVD plotted as coloured dots (green = bullish, red = bearish, grey = neutral).
EMA lines dynamically change colour with trend direction.
Price bars are recoloured to match the delta (green = buy pressure, red = sell pressure, grey = neutral).
Useful for spotting divergences between price and volume flow, identifying hidden accumulation/distribution, and confirming trend continuation or reversal signals.

Cumulative Volume Delta with SignalThis premium-grade technical indicator provides deep insights into market sentiment by tracking the difference between buying and selling pressure through volume analysis. SCVD offers a sophisticated approach to volume profile analysis, helping traders identify potential trend reversals and momentum shifts before price action confirms them.
Key Features:
Real-Time Volume Delta Analysis: Visualizes buying vs. selling pressure through color-coded candles
Smart Signal Line Integration: EMA-based signal line helps identify trend changes and trading opportunities
Multi-Timeframe Capabilities: Automatically selects optimal lower timeframes for precision or can be customized
Daily Reset Option: Anchor period functionality for intraday delta analysis
Professional Visualization: Clean, color-coded display with zero reference line
Trading Applications:
Identify divergences between price action and volume delta for potential reversals
Spot accumulation/distribution patterns through delta behavior
Use signal line crossovers for entry/exit timing
Confirm trend strength by analyzing delta momentum
Detect potential false breakouts through volume confirmation
Perfect for day traders, swing traders, and institutional investors who rely on volume analysis for decision-making. This indicator combines sophisticated volume delta metrics with an intuitive interface to provide actionable trading insights across all markets and timeframes.

Cumulative Volume Delta Strategy | Flux Charts💎 GENERAL OVERVIEW
Introducing the Cumulative Volume Delta Strategy (CVDS) Indicator, an advanced tool designed to enhance trading strategies by identifying potential trend reversals through volume dynamics. This script features integrated order block detection, Fair Value Gaps (FVGs), and a dynamic take-profit (TP) and stop-loss (SL) system. For an in-depth understanding of the strategy, refer to the "HOW DOES IT WORK?" section below.
Features of the new Cumulative Volume Delta Strategy (CVDS) Indicator :
Cumulative Volume Delta-based Strategy
Order Block and Fair Value Gap (FVG) Entry Methods
Dynamic TP/SL System
Customizable Risk Management Settings
Alerts for Buy, Sell, TP, and SL Signals
📌 HOW DOES IT WORK ?
The CVDS indicator operates by tracking the net volume difference between buyers and sellers to identify divergences that could indicate potential trend reversals. A cumulative volume delta (CVD) calculation is employed to measure the intensity of these divergences in relation to price movements. The net volume sum is reset every trading day (can be changed from the settings using the anchor period option), and divergences are detected when the cumulative volume crosses the 0-line over or under.
Once a significant divergence is detected, the indicator identifies breakout points, confirmed by either Fair Value Gaps (FVGs) or Order Blocks (OBs). Depending on your chosen entry mode, the indicator will trigger a buy or sell entry when the confirmation signal aligns with the breakout direction. Alerts for Buy, Sell, Take-Profit, and Stop-Loss are available.
Note that the indicator cannot run on 1-minute and 1-second charts, as it needs to get data from a lower timeframe. 1-minutes & 1-second timeframes are the minimum timeframes in their ranges respectively.
🚩 UNIQUENESS
What sets this indicator apart is the combination of volume divergence analysis with advanced price action tools like Fair Value Gaps (FVGs) and Order Blocks (OBs). The ability to choose between these methods, along with a dynamic TP/SL system that adapts based on volatility, provides flexibility for traders in any market condition. The backtesting dashboard provides metrics about the performance of the indicator. You can use it to tune the settings for best use in the current ticker. The CVD-based strategy ensures that trades are initiated only when meaningful divergences between volume and price occur, filtering out noise and increasing the likelihood of profitable trades.
⚙️ SETTINGS
1. General Configuration
Anchor Period: Time anchor period used in CVD calculation. This is essentially the period that the volume delta sum will be reset. Lower timeframes may result in more entries at the cost of less reliable results.
Entry Mode: Choose between FVGs or OBs to trigger your entries based on the confirmation signals.
Retracement Requirement: Enable to confirm the entry after a retracement toward the FVG or OB.
2. Fair Value Gaps
FVG Sensitivity: Modify the sensitivity of FVG detection, allowing for more or fewer gaps to be considered valid.
3. Order Blocks (OB)
Swing Length: Define the swing length to identify OB formations. Shorter lengths find smaller OBs, while longer lengths detect larger structures.
4. TP / SL
TP / SL Method:
a) Dynamic: The TP / SL zones will be auto-determined by the algorithm based on the Average True Range (ATR) of the current ticker.
b) Fixed : You can adjust the exact TP / SL ratios from the settings below.
Dynamic Risk: The risk you're willing to take if "Dynamic" TP / SL Method is selected. Higher risk usually means a better winrate at the cost of losing more if the strategy fails. This setting is has a crucial effect on the performance of the indicator, as different tickers may have different volatility so the indicator may have increased performance when this setting is correctly adjusted.

Enhanced Cumulative Volume Delta [NariCapitalTrading]Enhanced Cumulative Volume Delta (eCVD) Technical Guide
Introduction
The Enhanced Cumulative Volume Delta (eCVD) is a technical indicator in trading that measures the cumulative difference between buying and selling volume over a user-defined period. It helps in understanding market sentiment by showing whether buyers or sellers dominate.
Calculation
Inputs
Period : Number of bars for cumulative volume calculation (default: 14).
MA Period : Period for the moving average of eCVD (default: 20).
Volume Delta Calculation
Buying Volume (buyVolChange) : Counted as buying volume if the current close is greater than the previous.
Selling Volume (sellVolChange) : Counted as selling volume if the current close is less than the previous.
Cumulative Volume Delta (CVD)
Cumulative buying ( cumBuyVol ) and selling volumes ( cumSellVol ) are calculated.
Every period bars, these cumulative volumes are reset.
eCVD is the difference between cumulative buying and selling volumes.
CVD Moving Average
Simple Moving Average (SMA) of eCVD calculated over maPeriod .
Interpretation
eCVD Histogram
Plotted as a histogram.
Color Coding :
Green : Positive eCVD (more buying volume).
Red : Negative eCVD (more selling volume).
Black : No significant difference between buying and selling volume.
CVD Moving Average
Moving average line (yellow) indicates eCVD trend direction and strength.
Application
Trend Confirmation : Rising eCVD suggests an uptrend; falling eCVD suggests a downtrend.
Divergence : Opposite movements in price and eCVD can indicate potential reversals.
Volume Analysis : High eCVD values signal high trading activity, significant at market extremes.
Conclusion
The eCVD can be used to analyze buyer/seller dynamics through volume. It should be used alongside other methods for informed trading decisions.

Cumulative Volume DeltaThis Cumulative Volume Delta (CVD) indicator analyzes intra-bar volume dynamics. It introduces a periodic reset mechanism, anchoring the accumulation to a user-defined timeframe (e.g., daily, weekly) for cyclical analysis.
Key Features:
Dual CVD Calculation: The indicator computes two CVD values simultaneously:
Periodic CVD: Resets on the user-defined 'Anchor Timeframe'. This is plotted as "Delta Candles".
Continuous CVD: Accumulates volume continuously (non-resetting) and is used as the source for divergence detection.
Intra-Bar Delta Analysis: Uses a lower timeframe ('Intra-Bar Timeframe') to calculate buy/sell pressure based on the direction of the intra-bar candles.
"Delta Candle" Visualization: The periodic CVD is shown as a candle, where:
Open: The CVD value at the start of the period (or zero).
High/Low: Represent the peak buying (CVD High) and selling (CVD Low) pressure within that period.
Close: The final net delta value for that period.
Full Divergence Suite (Class A, B, C): A built-in engine automatically detects and plots Regular (A), Hidden (B), and Exaggerated (C) divergences between price and the continuous CVD line.
Dynamic Divergence Plotting: Divergence markers are plotted relative to the periodic (candle) CVD. They automatically adjust their vertical position after a reset to remain visually aligned with the plotted candles.
Note on Confirmation (Lag): Divergence signals rely on a pivot confirmation method to ensure they do not repaint.
The Start of a- divergence is only detected after the confirming pivot is fully formed (a delay based on Pivot Right Bars).
The End of a divergence is detected either instantly (if the signal is invalidated by price action) or with a delay (when a new, non-divergent pivot is confirmed).
Multi-Timeframe (MTF) Capability:
MTF Output: The entire dual-CVD analysis can be run on a higher timeframe (using the Timeframe input), with standard options to handle gaps (Fill Gaps) and prevent repainting (Wait for...).
Limitation: The Divergence detection engine (pivDiv) is disabled if a Higher Timeframe (HTF) is selected.
Integrated Alerts: Includes 18 comprehensive alerts for:
The start and end of all 6 divergence types.
The periodic CVD crossing the zero line.
Conditions of agreement or disagreement between the delta and the main bar's direction.
Caution: Real-Time Data Behavior (Intra-Bar Repainting) This indicator uses high-resolution intra-bar data. As a result, the values on the current, unclosed bar (the real-time bar) will update dynamically as new intra-bar data arrives. This behavior is normal and necessary for this type of analysis. Signals should only be considered final after the main chart bar has closed.
DISCLAIMER
For Informational/Educational Use Only: This indicator is provided for informational and educational purposes only. It does not constitute financial, investment, or trading advice, nor is it a recommendation to buy or sell any asset.
Use at Your Own Risk: All trading decisions you make based on the information or signals generated by this indicator are made solely at your own risk.
No Guarantee of Performance: Past performance is not an indicator of future results. The author makes no guarantee regarding the accuracy of the signals or future profitability.
No Liability: The author shall not be held liable for any financial losses or damages incurred directly or indirectly from the use of this indicator.
Signals Are Not Recommendations: The alerts and visual signals (e.g., crossovers) generated by this tool are not direct recommendations to buy or sell. They are technical observations for your own analysis and consideration.

Cumulative Volume Delta Candles Aggregated (Lite)Cumulative Volume Delta Candles Aggregated (Lite)
Multi-Exchange CVD Visualization in Candle Format
This indicator provides an aggregated Cumulative Volume Delta (CVD) view across multiple major perpetual futures exchanges in one chart. It is designed for traders who want a broader perspective on buying and selling pressure without switching between multiple charts or relying on a single exchange feed.
What It Does
Combines volume delta data from Binance, Bybit, OKX, Bitget, and Coinbase into a unified representation.
Displays CVD as candlesticks, where each candle reflects the open, high, low, and close of cumulative delta for the selected period.
Offers a clear visual of how buying and selling pressure evolves across markets in a structured, familiar candle format.
Key Features
✔ Exchange Aggregation: Incorporates data from several top futures markets available on TradingView.
✔ Anchor Reset: Allows you to set an anchor timeframe (e.g., daily) to reset cumulative values for better readability and analysis.
✔ Unit Normalization: Since exchanges report volumes in different units, the indicator normalizes all data and outputs values denominated in the base currency (coins) for consistency.
✔ Hidden OHLC Outputs: Provides open, high, low, and close values as hidden plots for use with other indicators or strategies.
✔ Lightweight Design: Optimized for efficiency while handling multiple real-time data requests.
Why It’s Different
Unlike standard single-exchange CVD tools, this indicator aggregates the majority of perpetual volume data available on TradingView, offering a more representative view of market sentiment. The candle-based representation of CVD introduces an additional layer of structure, helping traders identify shifts in momentum and pressure with more context than a simple cumulative line.
Use Cases
- Spotting aggregated buy/sell pressure trends across multiple exchanges.
- Confirming breakout or reversal signals with broader volume delta context.
- Serving as a custom data source for other indicators or algorithmic strategies.

Up/Down Volume Delta %this script is based on FractalTrade_'s rendition of the up/down volume bars.
the shortcomings of that chart were that large volume bars caused the auto-scaling to shrink smaller volume bar displays to the point where much of the data was too small to see.
in this chart, the bars are displaying the percent delta out of the total bar volume. this way, large overall volume bars do not cause visual compression to everything else in the chart.
I've used color modulation to indicate relation to a relative volume point, so users can still tell when overall volume is large or small. when volume is under a moving average, the bars will display at a basis transparency. when the volume is over the average, the brightness will increase up to a specific ratio of volume defined by the user.
for example, if basis transparency is at 20, and the full opacity ratio is at 3, and the volume average is at 1M, a volume of 750k will display the delta bar at the basis transparency. a volume of 3M will achieve full brightness. a volume of 2M will display with moderate brightness (about 60%), but still stand out against other bars with basis transparency.
areas of the chart that are either increasing bar sizes or increasing in brightness can indicate directional force. when volume delta direction contradicts the candle direction, this can indicate support / resistance.

Cumulative Volume Delta with Divergence🧠 Core Functionality:
1. Cumulative Volume Delta (CVD):
Purpose: Visualizes the difference between buying and selling pressure over time.
Mechanism:
It uses lower-timeframe volume delta data, retrieved from ta.requestVolumeDelta(), to build a candle-style visualization of the net volume movement.
Plotted candles show whether buying (up volume) or selling (down volume) was dominant within each period.
Teal candles: More buying than selling (CVD up).
Red candles: More selling than buying (CVD down).
Volume Source: Based on intrabar up/down volume approximation from lower timeframes.
🧭 Divergence Detection (New Feature):
2. Regular Bullish Divergence:
Condition:
Price makes a lower low.
CVD (lastVolume) makes a higher low.
Interpretation: Selling pressure is weakening despite price making new lows — a potential reversal signal to the upside.
Displayed As:
Green line and label "Bull" under the CVD at the divergence point.
3. Regular Bearish Divergence:
Condition:
Price makes a higher high.
CVD makes a lower high.
Interpretation: Buying pressure is fading despite price rising — a potential reversal signal to the downside.
Displayed As:
Red line and label "Bear" above the CVD at the divergence point.
🧰 User Controls:
Use custom timeframe: Overrides default volume delta resolution for finer or broader analysis.
Calculate Divergence: Turns the divergence detection on or off.
Adjustable via script inputs.
🔔 Alerts:
Two alert conditions are included:
One for bullish divergence.
One for bearish divergence.
Alerts trigger at the bar where the divergence is confirmed, not where it starts.
📈 Use Case:
This tool is ideal for traders looking to:
Spot early reversals or momentum shifts.
Combine volume analysis with price action.
Time entries or exits more accurately using volume-confirmed divergence.

Cumulative Volume Delta Custom AlertDescription
This script calculates and visualizes the Cumulative Volume Delta (CVD) on multiple timeframes, enabling traders to monitor volume-based price action dynamics. The CVD is calculated based on up and down volume approximations and displayed as a candle plot, with color-coded alerts when significant changes occur.
Key Features:
Multi-Timeframe Analysis: The script uses a customizable anchor period and a lower timeframe for scanning, allowing it to capture more granular volume movements.
Volume-Based Trend Detection: Plots CVD candles with color indicators (teal for increasing volume delta, red for decreasing), helping traders to visually track volume trends.
Dynamic Alerts for Volume Shifts:
Triggers an alert when there is a significant (over 25%) change in CVD between consecutive periods.
The alert marker color adapts based on the current CVD value:
Blue when the current CVD is positive.
Yellow when the current CVD is negative.
Markers are placed above bars for volume increases and below for volume decreases, simplifying visual analysis.
Customizable Background Highlight: Adds a background highlight to emphasize significant CVD changes.
Use Cases:
Momentum Detection: Traders can use alerts on large volume delta changes to identify potential trend reversals or continuation points.
Volume-Driven Analysis: CVD helps distinguish buy and sell pressure across different timeframes, ideal for volume-based strategies.
How to Use
Add the script to your TradingView chart.
Configure the anchor and lower timeframes in the input settings.
Set up alerts to receive notifications when a 25% change in CVD occurs, with color-coded markers for easy identification.

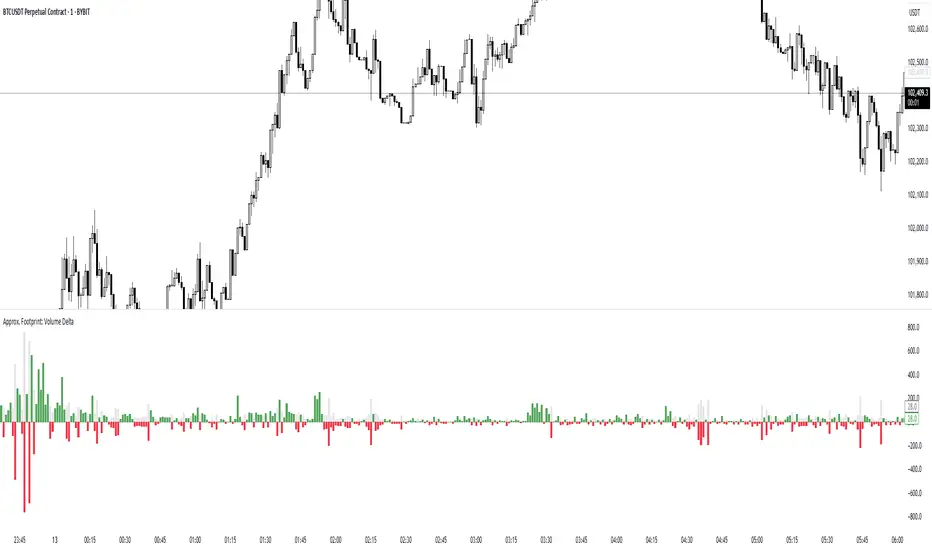
Approx. Footprint: Volume DeltaThis indicator brings you a simplified “footprint” view by charting the volume delta—the imbalance between bullish and bearish volume—alongside total bar volume.
Delta Bars: Green/red columns show where buyers (close > open) or sellers (close < open) dominated each bar.
Total Volume: Semi-transparent gray columns in the background give you overall context.
No Hidden Data: Works on any symbol/timeframe without tick-by-tick or bid/ask feeds.
Use it to quickly spot bars with strong buying or selling pressure, identify momentum shifts, and confirm breakouts or reversals—all within TradingView’s standard volume streams.
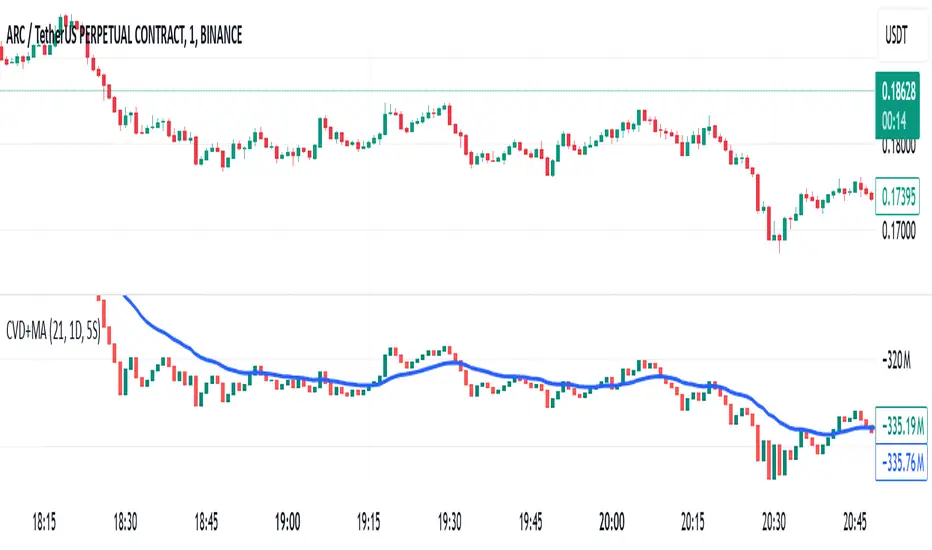
Cumulative Volume Delta with MACVD is a volume-based indicator that helps analyze buying and selling pressure in the market. It tracks the difference between buying volume and selling volume, showing whether the market is being accumulated or distributed.
How CVD Works
Volume Delta Calculation:
If price closes higher than the previous bar → Volume is added to CVD (buying pressure).
If price closes lower than the previous bar → Volume is subtracted from CVD (selling pressure).
CVD Cumulative Calculation:
Keeps a running total of volume delta over time.
If the CVD line is rising, buyers are in control; if falling, sellers dominate.
Moving Average on CVD:
A moving average (MA) smooths out the CVD line, helping identify trends more clearly.
Common choices: EMA (Exponential MA) or SMA (Simple MA).
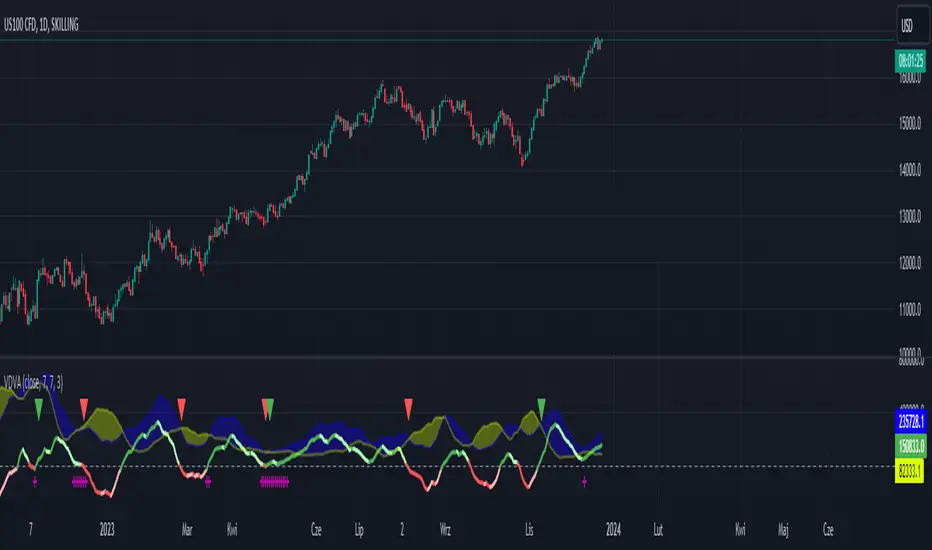
VDVA - Volume Delta Volatility AmplifierThis script defines an indicator named VDVA (Volume Delta Volatility Amplifier), which combines volume delta (the difference between volume up and volume down) and volatility (ATR) into one line. This line is then smoothed using a moving average and compared with the zero level and a shorter-period moving average. The script also plots shapes when the rate of change of the line exceeds the first standard deviation. Moreover, the script uses Bollinger Bands and Keltner Channels to determine the squeeze condition, which is a signal of a potential breakout. Finally, the script plots two bar charts that show the volume up and volume down multiplied by ATR.
dark green line - bullish
light green line - potential bearish
dark red line - bearish
light red line - potential bullish
blue cloud - bullish
yellow cloud - bearish
red triangle - bearish entry
green triangle - bullish entry
purple cross - squeeze
LTF -> HTF volume delta Up/DownThis script derives from my previous Educational LTF -> HTF volume delta script.
Total volume is displayed as columns in the background.
With request.security_lower_tf() we get data from a lower timeframe.
In this case, volume, which is placed in an 'up-array' when the 'lower timeframe close' > 'lower timeframe open',
or in an 'down-array' when the 'lower timeframe close' < 'lower timeframe open'.
This is displayed here as 2 (red/green) lines
When you're at a chart timeframe (Higher timeframe), lower than Daily, the lower timeframe is automatically 50x smaller than the higher timeframe.
Example D = 1440 minutes -> divided by 50 = 28.8 or rounded a lower timeframe of 29 minutes
When this number is below 1, it will take the '1 minute timeframe' as lower timeframe
If the higher timeframe chart is Daily or higher, a 'x minute-lower timeframe' chart is calculated from the timeframe.multiplier multiplied by 25,
for example a 2D higher timeframe will do the 'lower timeframe calculations' with a 50 minute TF (25 * 2 'D')
Looking at for example BTC on the Daily higher timeframe, some interesting observations can be done when looking at the 'spikes'
This script doesn't have build in arrows, it is merely made to give some stimulation,
and hopefully some of you can work further on this technique, because I think it is very promising!
I want to thank Tradingview very deeply, why?
Just so many reasons, development, moderation, organisation, helpdesk, ...
The amount of work they are doing is incredible!

Cumulative Volume DeltaThis indicator is called Cumulative Volume Delta (CVD), and it is the cumulative difference between buying and selling pressure.
Note, however, that it is not an exact CVD, because Pine Script does not allow you to get the Bid Volume and Ask Volume.
Instead, it uses volume and candlestick length to determine the pressure.
Example: Volume is 100, price change is +1.0% → Buying pressure is 1
Volume is 100, price change is -0.5% → Selling pressure is 0.5
このインジケーターは、Cumulative Volume Delta(CVD)と呼ばれるもので、買い圧力と売り圧力の差を累積したものです。
しかし、Pine Scriptでは買い圧力と売り圧力(Bid VolumeとAsk Volume)を取得することはできないため、正確なCVDではないことに注意してください。
代わりに出来高とローソク足の長さで圧力を判断判断しています。
例:出来高が100、価格の変動が+1.0% → 買い圧力は1
出来高が100、価格の変動が-0.5% → 売り圧力は0.5
Market Session Boxes with Volume Delta [algo_aakash]This script highlights four key forex trading sessions — Tokyo, London, New York, and Sydney — by drawing color-coded boxes directly on the chart. For each session, it shows:
High and low of the session
Total volume traded
Volume delta (bullish vs bearish pressure)
Optional extension of session highs/lows into future candles
Cleanly labeled time range and stats
Users can:
Select which sessions to display
Customize session times (in UTC+0)
Choose colors per session
Toggle session labels and extension lines
Use Case: Designed to help intraday and short-term traders visualize market rhythm, liquidity zones, and session-based volatility. The volume delta metric adds an extra layer of sentiment analysis.
This tool works best on intraday timeframes like 15m, 30m, or 1H.
Disclaimer:
This indicator is for educational and visual analysis purposes. It does not constitute trading advice or guarantee results. Always conduct your own analysis before making trading decisions.

Cumulative Volume Delta DivergenceThe Cumulative Volume Delta Divergence is an indicator that helps traders visually assess the buying and selling pressures in the market by analyzing volume divergences over time. This indicator overlays directly on the price chart, offering insights into how volume shifts correlate with price movements.
Utility and Trading Benefit
Divergence Detection
The primary utility of this indicator lies in its ability to detect divergences between volume trends and price movements. Such divergences can signal potential price reversals, providing traders with early warnings about shifts in market sentiment.
Enhanced Decision Making
By integrating volume analysis directly with price action on the chart, the indicator aids traders in making more informed decisions regarding entry and exit points. This can be crucial for capitalizing on trends or avoiding potential losses.

Educational LTF -> HTF volume deltaThis script shows 1 of several technique to gather volume delta
-> more explanation can be found in the script itself,
Cheers!
Cumulative Volume Delta Divergence Periodic EMACumulative Volume Delta Divergence Periodic EMA
extended indicator
CVD (Cumulative Volume Delta)
Cumulative Volume Delta
Use a moving average with three different
I thought about determining the volatility and direction of the price of the stock price and finding a place to break through.
I made some Mistake coz I'm new corder
I'm reposting this simple script due to house rule violation. (Whatever can haha) 😁
I'm erasing all the comments in my native language that I had in my script... I thought it would make the User uncomfortable, so I locked the code, and I thought maybe that's the problem
Anyway, I'm sorry 😅

Volume DeltaThis script is meant to only show you the most significant volume moves. The way it works is it takes the cumulative sum of the delta of the volume. You can go from current all the way to ten bars back in your delta window.
Review on what volume is: The Volume indicator measures how much of a given financial asset has traded in a specific period of time. Volume is measured by shares traded for stocks, whereas for futures, it is based on the number of contracts.
