The Ultimate TripleX Trading StrategyThe strategy is now set to wor with the 15 Minutes timeframe, but you can adjust it to work with any timeframe.
Recherche dans les scripts pour "the strat"

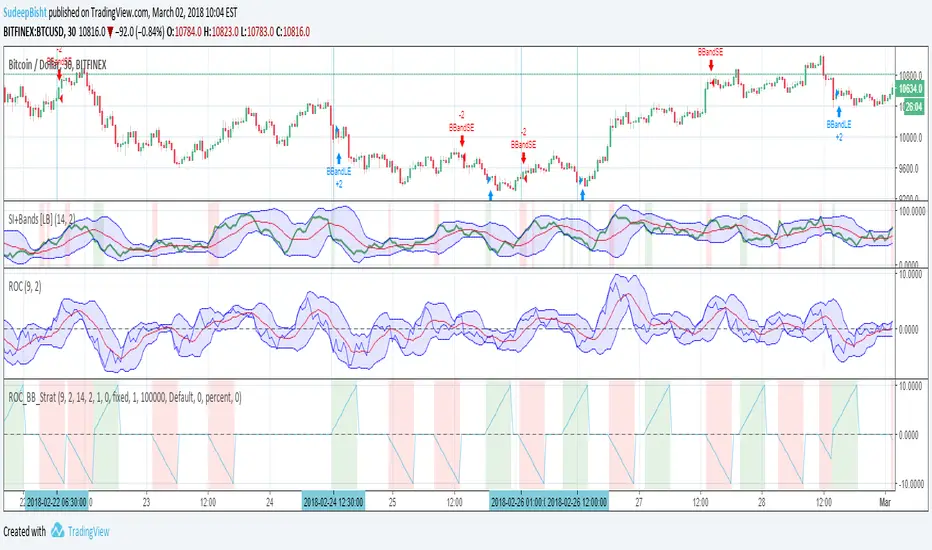
Sb_Rate_Of_Change_BB_Band_strategy Version 1.0The strategy couples the concept of rate of change along with the Bollinger bands.
Along with it LazyBear's RSI/MFI with Volatility Indicator is also taken to reduce the number of trades and improve efficiency.
Strategy (in Layman terms):
If in the past 10 candles RSI/MFI with Volatility Indicator has printed a red/green colour and the roc has gone above/below the Bollinger bands then the short/long order is placed respectively.
Message if you think of any modifications/ enhancements/ any opportunities. :)
Donations/Tips... :) -
BTC: 1BjswGcRR6c23pka7qh5t5k56j46cuyyy2
ETH: 0x64fed71c9d6c931639c7ba4671aeb6b05e6b3781
LTC: LKT2ykQ8QSzzfTDB6Tnsf12xwYPjgq95h4
SB_Compliment_RSI StrategyThe strategy modifies the original rsi strategy with the addition of compliment si (i.e. 100-rsi).
Strategy Idea: Previous rsi high and low value is recorded when the rsi crosses overBought(70) and OverSold(30) values.
Now when the rsi crosses above the overSold range, the rsi is matched with the compliment of previous high rsi value. If the compliment i.e.(100-prev_rsi_high) is less than or equal to rsi then long position is taken.
For short position, when the rsi crosses below the overBought range, the rsi is matched with the compliment of previous low rsi value. If compliment i.e.(100-prev_rsi_low) is greater than or equal to rsi.
Below s the code for the indicator present in the chart.
//@version=3
study(title="SB_Compliment_Relative Strength Index", shorttitle="RSI")
src = close, len = input(14, minval=1, title="Length")
up = rma(max(change(src), 0), len)
down = rma(-min(change(src), 0), len)
rsi = down == 0 ? 100 : up == 0 ? 0 : 100 - (100 / (1 + up / down))
plot(rsi, color=purple)
plot(100-rsi, color=orange)
band1 = hline(70)
band0 = hline(30)
fill(band1, band0, color=purple, transp=90)
The code also has switch code also which means it will enter the overBrought or overSold block one after the other.
Future modifications: Currently the value of rsi tracked is the one in which it crosses the overSold or OverBought range and not the highest/lowest value when the value is above/below OverBought/OverSold range.
Comment the perfect combination of indicators for it and will try to incorporate those indicators into it in the next version.
Message if you think of any modifications/ enhancements/ any opportunities. :)
Donations/Tips... :) -
BTC: 1BjswGcRR6c23pka7qh5t5k56j46cuyyy2
ETH: 0x64fed71c9d6c931639c7ba4671aeb6b05e6b3781
LTC: LKT2ykQ8QSzzfTDB6Tnsf12xwYPjgq95h4

SB_Elder Impulse SystemThe strategy is based on LazyBear's Elder Impulse System
Strategy(in layman terms):
Long: When the green bar in the Elder Impulse System's indicator shows up
Short: When the red bar in the Elder Impulse System's indicator shows up
Close trade/Profit booking: When the blue bar in the Elder Impulse System's indicator shows up
Original Idea:
Message in the script if you think of any modifications/ enhancements.
Donations/Tips... :) -
BTC: 1BjswGcRR6c23pka7qh5t5k56j46cuyyy2
ETH: 0x64fed71c9d6c931639c7ba4671aeb6b05e6b3781
LTC: LKT2ykQ8QSzzfTDB6Tnsf12xwYPjgq95h4

Rainbow StrategyThe strategy is based on the following idea:
www.youtube.com
Not a fan of this but no script was present to show this idea's performance.
Best suitable for the 1-minute chart. You can change the ema values as per your needs.
For Tips to continue :) -
BTC: 1BjswGcRR6c23pka7qh5t5k56j46cuyyy2
ETH: 0x64fed71c9d6c931639c7ba4671aeb6b05e6b3781
LTC: LKT2ykQ8QSzzfTDB6Tnsf12xwYPjgq95h4

SB_CM_RSI_2_Strategy_Version 1.0The strategy is based on the indicator posted by @ChrisMoody "CM RSI-2 Strategy Lower Indicator" which is based on "Larry Connors RSI-2 Strategy - Lower RSI"
In this strategy the longs are placed when a green color is encountered in the rsi and short when red color is encountered in the rsi.
Although the profits can be booked at different interval.
Just message in the script if you have any different idea regarding this indicator.
For the original indicator you can refer to :
For Tips to continue :) :
BTC: 1BjswGcRR6c23pka7qh5t5k56j46cuyyy2
ETH: 0x64fed71c9d6c931639c7ba4671aeb6b05e6b3781
LTC: LKT2ykQ8QSzzfTDB6Tnsf12xwYPjgq95h4

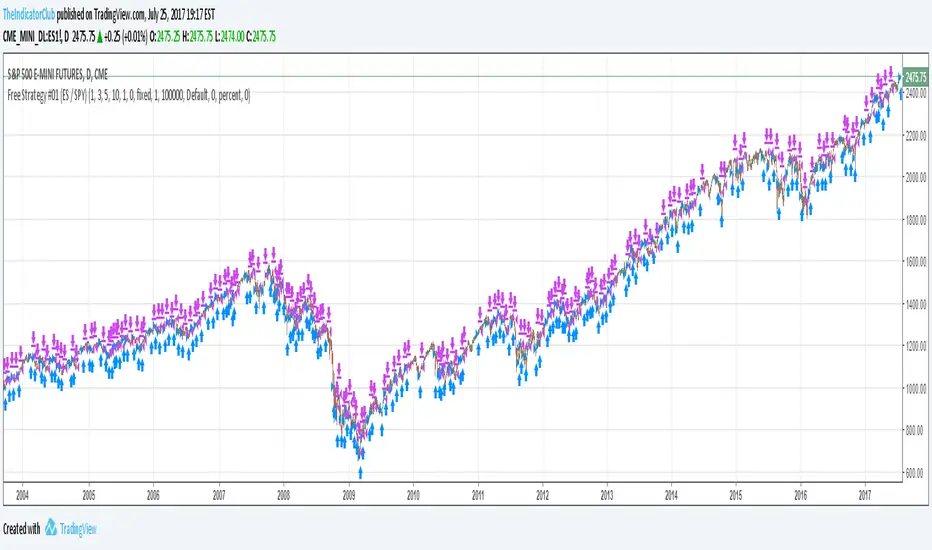
Free Strategy #01 (ES / SPY)The strategy was designed to be traded based on daily data on the ES and SPY--the strategy was originally developed on NinjaTrader using approximately 50% out of sample data with a slippage of 1 tick on the ES. This is our first strategy that we converted from NinjaTrader to TradingView, so if you see any issues with our conversion, please let us know as we are still learning TradingView Pine Script.
Rawa_Trade_System_Vol_AdxThe strategy must be configured for each instrument separately; the basic configuration uses a trailing stop, a 4H timeframe, and excludes margin trading.

CE+ZLSMA RovTrading StrateryThe strategy is optimized for scalping in small timeframes like M15 and M30, as well as M5.
It combines two indicators: CE and ZLSMA.
Try it now!

dabilThe strategy is probably to go short or long with the trend depending on the case, but if all time units 1 minute then 3 minutes then 5 minutes then 15 minutes then 1 hour all show the same direction, but first the 1 hour must be bullish in which the 1 hour candle closes above the previous one, for example if the trend is bearish then the market wants to change direction, then a 1 hour bullish close must then be followed by a 1 hour bearish close below the bullish candle, then another bullish candle must shoot above the previous bullish candle, then 15 minutes also shoot above the previous 15 bullish candles, then 1 and 2...3.5. Then I can rise with the market by only covering the last 15 bullish candles with my stop loss, if my SL is 50 pips then I want 100 pips and then I'm out.

MomentumThe strategy uses EMA200, ADX/DMI, RSI, and volume. Pivot levels and Heikin-Ashi ensure safe entries, while cooldowns and opposite-locks prevent overtrading. Exits are managed with ATR trailing stops and trend-reversal signals.

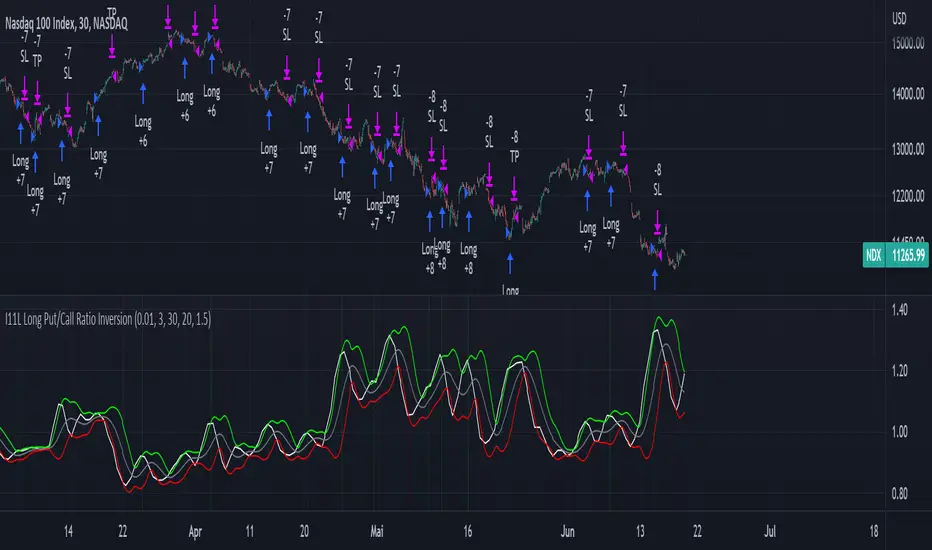
I11L Long Put/Call Ratio InversionThe Strategy uses the Put/Call Options Ratio Inversaion as a Signal and Implements simple Money Management rules.
It is adjusted for the NDX and for the SPX in the 30min Range.
The Oscilation has to be finetuned to reflect the correct Reversal point.
A good indicator of the correct Reversal Point is a solid range of good backtesting results..
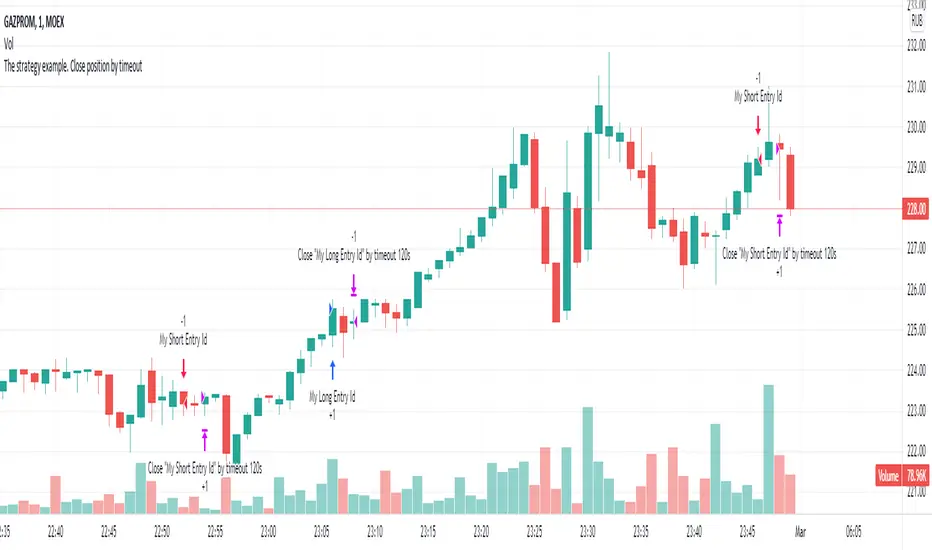
The strategy example. Close position by timeoutThis is an example how to close open entries by timeout for educational purpose.
Arjun_Bhatia_Alligator_StrategyThe strategy utilizes the alligator indicator on bank nifty HA candles and bank nifty futures charts.

Trend Following or Mean RevertingThe strategy checks nature of the instruments. It Buys if the close is greater than yesterday's high, reverse the position if the close is lower than yesterday's low and repeat the process.
1. If it is trend following then the equity curve will be in uptrend
2. If it is mean reverting then the equity curve will be downtrend
Thanks to Rayner Teo.

Bollinger and Tendencies (Bollinger e Tendências )The strategy consists of buying when the price breaks up (crossover) the bottom line of the Bollinger and selling when the price breaks down (crossunder) to your top line.
The chart still shows trends clearly, with the fill between the exponential average and the closing value of the canlestick, green at high, red at low (this part of the script is based on the code: "Pivot Daily Price Color" by Rimko).
It also places notes on the high and low candlesticks (based on the code: "Candlesticks Pattern Identified" by Repo32).
It is recommended to use it in conjunction with the "IFR and Storage" script (also available to me), and some volume script.
A estratégia consiste em comprar quando o preço rompe para cima (crossover) a linha inferior do Bollinger e vender quando o preço rompe para baixo (crossunder) a sua linha superior.
O gráfico ainda mostra as tendências de forma clara, com o preenchimento entre a média exponencial e o valor de fechamento do canlestick, verde em alta, vermelho em baixa (essa parte do script é baseada no código: "Pivot Daily Price Color" do usuário: Rimko).
Também, coloca apontamentos nos candlesticks de alta e de baixa (baseado no código: "Candlesticks Pattern Identified" do usuário Repo32).
Recomenda-se a utilização em conjunto com o script "IFR e Estocagem" (também por mim disponibilizado), e algum script de volume.

SB_Volume_oscillator_Prev_high_lowThe strategy is a take on traditional volume oscillator.
In Layman terms:
The script places an order when the oscillator crosses the zero mark in the volume oscillator.
If the previous high is greater than the absolute value of previous low then a long order is placed
And if the absolute previous low is greater than the previous high then a shrt order is placed.
Last script (bandwidth focus on other monetary works. If you have any opportunities ping me)
Message if you think of any modifications/ enhancements/ any opportunities. :)
Donations/Tips... :) -
BTC: 1BjswGcRR6c23pka7qh5t5k56j46cuyyy2
ETH: 0x64fed71c9d6c931639c7ba4671aeb6b05e6b3781
LTC: LKT2ykQ8QSzzfTDB6Tnsf12xwYPjgq95h4
ChronoPulse MS-MACD Resonance StrategyChronoPulse MS-MACD Resonance Strategy
A systematic trading strategy that combines higher-timeframe market structure analysis with dual MACD momentum confirmation, ATR-based risk management, and real-time quality assurance monitoring.
Core Principles
The strategy operates on the principle of multi-timeframe confluence, requiring agreement between:
Market structure breaks (CHOCH/BOS) on a higher timeframe
Dual MACD momentum confirmation (classic and crypto-tuned profiles)
Trend alignment via directional EMAs
Volatility and volume filters
Quality score composite threshold
Strategy Components
Market Structure Engine : Detects Break of Structure (BOS) and Change of Character (CHOCH) events using confirmed pivots on a configurable higher timeframe. Default structure timeframe is 240 minutes (4H).
Dual MACD Fusion : Requires agreement between two MACD configurations:
Classic MACD: 12/26/9 (default)
Fusion MACD: 8/21/5 (default, optimized for crypto volatility)
Both must agree on direction before trade execution. This can be disabled to use single MACD confirmation.
Trend Alignment : Uses two EMAs for directional bias:
Directional EMA: 55 periods (default)
Execution Trend Guide: 34 periods (default)
Both must align with trade direction.
ATR Risk Management : All risk parameters are expressed in ATR multiples:
Stop Loss: 1.5 × ATR (default)
Take Profit: 3.0 × ATR (default)
Trail Activation: 1.0 × ATR profit required (default)
Trail Distance: 1.5 × ATR behind price (default)
Volume Surge Filter : Optional gate requiring current volume to exceed a multiple of the volume SMA. Default threshold is 1.4× the 20-period volume SMA.
Quality Score Gate : Composite score (0-1) combining:
Structure alignment (0.0-1.0)
Momentum strength (0.0-1.0)
Trend alignment (0.0-1.0)
ATR volatility score (0.0-1.0)
Volume intensity (0.0-1.0)
Default threshold: 0.62. Trades only execute when quality score exceeds this threshold.
Execution Discipline : Trade budgeting system:
Maximum trades per session: 6 (default)
Cooldown bars between entries: 5 (default)
Quality Assurance Console : Real-time monitoring panel displaying:
Structure status (pass/fail)
Momentum confirmation (pass/fail)
Volatility readiness (pass/fail)
Quality score (pass/fail)
Discipline compliance (pass/fail)
Performance metrics (win rate, profit factor)
Net PnL
Certification requires: Win Rate ≥ 40%, Profit Factor ≥ 1.4, Minimum 25 closed trades, and positive net profit.
Integrity Suite : Optional validation panel that audits:
Configuration sanity checks
ATR data readiness
EMA hierarchy validity
Performance realism checks
Strategy Settings
strategy(
title="ChronoPulse MS-MACD Resonance Strategy",
shorttitle="ChronPulse",
overlay=true,
max_labels_count=500,
max_lines_count=500,
initial_capital=100000,
currency=currency.USD,
pyramiding=0,
commission_type=strategy.commission.percent,
commission_value=0.015,
slippage=2,
default_qty_type=strategy.percent_of_equity,
default_qty_value=2.0,
calc_on_order_fills=true,
calc_on_every_tick=true,
process_orders_on_close=true
)
Key Input Parameters
Structure Timeframe : 240 (4H) - Higher timeframe for structure analysis
Structure Pivot Left/Right : 3/3 - Pivot confirmation periods
Structure Break Buffer : 0.15% - Buffer for structure break confirmation
MACD Fast/Slow/Signal : 12/26/9 - Classic MACD parameters
Fusion MACD Fast/Slow/Signal : 8/21/5 - Crypto-tuned MACD parameters
Directional EMA Length : 55 - Primary trend filter
Execution Trend Guide : 34 - Secondary trend filter
ATR Length : 14 - ATR calculation period
ATR Stop Multiplier : 1.5 - Stop loss in ATR units
ATR Target Multiplier : 3.0 - Take profit in ATR units
Trail Activation : 1.0 ATR - Profit required before trailing
Trail Distance : 1.5 ATR - Distance behind price
Volume Threshold : 1.4× - Volume surge multiplier
Quality Threshold : 0.62 - Minimum quality score (0-1)
Max Trades Per Session : 6 - Daily trade limit
Cooldown Bars : 5 - Bars between entries
Win-Rate Target : 40% - Minimum for QA certification
Profit Factor Target : 1.4 - Minimum for QA certification
Minimum Trades for QA : 25 - Required closed trades
Signal Generation Logic
A trade signal is generated when ALL of the following conditions are met:
Higher timeframe structure shows bullish (CHOCH/BOS) or bearish structure break
Both MACD profiles agree on direction (if fusion enabled)
Price is above both EMAs for longs (below for shorts)
ATR data is ready and above minimum threshold
Volume exceeds threshold × SMA (if volume gate enabled)
Quality score ≥ quality threshold
Trade budget available (under max trades per day)
Cooldown period satisfied
Risk Management
Stop loss and take profit are set immediately on entry
Trailing stop activates after 1.0 ATR of profit
Trailing stop maintains 1.5 ATR distance behind highest profit point
Position sizing uses 2% of equity per trade (default)
No pyramiding (single position per direction)
Limitations and Considerations
The strategy requires sufficient historical data for higher timeframe structure analysis
Quality gate may filter out many potential trades, reducing trade frequency
Performance metrics are based on historical backtesting and do not guarantee future results
Commission and slippage assumptions (0.015% + 2 ticks) may vary by broker
The strategy is optimized for trending markets with clear structure breaks
Choppy or ranging markets may produce false signals
Crypto markets may require different parameter tuning than traditional assets
Optimization Notes
The strategy includes several parameters that can be tuned for different market conditions:
Quality Threshold : Lower values (0.50-0.60) allow more trades but may reduce average quality. Higher values (0.70+) are more selective but may miss opportunities.
Structure Timeframe : Use 240 (4H) for intraday trading, Daily for swing trading, Weekly for position trading
Volume Gate : Disable for low-liquidity pairs or when volume data is unreliable
Dual MACD Fusion : Disable for mean-reverting markets where single MACD may be more responsive
Trade Discipline : Adjust max trades and cooldown based on your risk tolerance and market volatility
Non-Repainting Guarantee
All higher timeframe data requests use lookahead=barmerge.lookahead_off to prevent repainting. Pivot detection waits for full confirmation before registering structure breaks. All visual elements (tables, labels) update only on closed bars.
Alerts
Three alert conditions are available:
ChronoPulse Long Setup : Fires when all long entry conditions are met
ChronoPulse Short Setup : Fires when all short entry conditions are met
ChronoPulse QA Certification : Fires when Quality Assurance console reaches CERTIFIED status
Configure alerts with "Once Per Bar Close" delivery to match the non-repainting design.
Visual Elements
Structure Labels : CHOCH↑, CHOCH↓, BOS↑, BOS↓ markers on structure breaks
Directional EMA : Orange line showing trend bias
Trailing Stop Lines : Green (long) and red (short) trailing stop levels
Dashboard Panel : Real-time status display (structure, MACD, ATR, quality, PnL)
QA Console : Quality assurance monitoring panel
Integrity Suite Panel : Optional validation status display
Recommended Usage
Forward test with paper trading before live deployment
Monitor the QA console until it reaches CERTIFIED status
Adjust parameters based on your specific market and timeframe
Respect the trade discipline limits to avoid over-trading
Review quality scores and adjust threshold if needed
Use appropriate commission and slippage settings for your broker
Technical Implementation
The strategy uses Pine Script v6 with the following key features:
Multi-timeframe data requests with lookahead protection
Confirmed pivot detection for structure analysis
Dynamic trailing stop management
Real-time quality score calculation
Trade budgeting and cooldown enforcement
Comprehensive dashboard and monitoring panels
All source code is open and available for review and modification.
Disclaimer
This script is for educational and informational purposes only. It is not intended as financial, investment, or trading advice. Past performance does not guarantee future results. Trading involves substantial risk of loss and is not suitable for all investors. Always conduct your own research and consult with a qualified financial advisor before making any trading decisions. The author and TradingView are not responsible for any losses incurred from using this strategy.

VWolf - Shadow PulseOVERVIEW
The Trend Momentum Breakout Strategy is a rule-based trading system designed to identify high-probability entries in trending markets using a combination of trend confirmation, momentum filtering, and precise trigger conditions. The strategy is suitable for intermediate to advanced traders who prefer mechanical systems with clear entry/exit logic and configurable risk management options.
At its core, this strategy seeks to enter pullbacks within strong trends, capitalizing on momentum continuation after brief pauses in price movement. By integrating multiple moving averages (MAs) for trend validation, ADX (Average Directional Index) as a strength filter, and Stochastic RSI as an entry trigger, the strategy filters out weak trends and avoids overextended market conditions. Exit logic is based on a customizable fixed stop-loss (SL) and take-profit (TP) framework, with optional dynamic risk-reduction mechanisms powered by the Supertrend indicator.
This strategy is designed to perform best in clearly trending markets and is especially effective in avoiding false breakouts or choppy sideways action thanks to its ADX-based filtering. It can be deployed across a variety of asset classes, including forex, stocks, cryptocurrencies, and indices, and is optimized for intra-day to swing trading timeframes.
RECOMMENDED USE
This strategy is designed to be flexible across multiple markets, but it performs best under certain conditions:
Best Suited For:
Trending markets with clear directional momentum.
High-volume instruments that avoid erratic price action.
Assets with intraday volatility and swing patterns.
Recommended Asset Classes:
Forex pairs (e.g., EUR/USD, GBP/JPY)
Cryptocurrencies (e.g., BTC/USD, ETH/USDT)
Major indices (e.g., S&P 500, NASDAQ, DAX)
Large-cap stocks (especially those with consistent liquidity)
Suggested Timeframes:
15-minute to 1-hour charts for intraday setups.
4-hour and daily charts for swing trading.
Lower timeframes (1–5 min) may generate too much noise unless fine-tuned.
Market Conditions to Avoid:
Ranging or sideways markets with low ADX values.
Assets with irregular price structures or low liquidity.
News-heavy periods with unpredictable price spikes.
CONCLUSION
This strategy stands out for its robust and modular approach to trend-following trading, offering a high level of customization while maintaining clear logic and structural discipline in entries and exits. By combining three distinct layers of confirmation—trend identification (via configurable moving averages), trend strength validation (via the DMI filter), and timing (via the Stochastic RSI trigger)—it aims to reduce noise and increase the probability of entering trades with directional bias and momentum on its side.
Its flexibility is one of its strongest points: users can tailor the strategy to fit various trading styles and market conditions. Whether the trader prefers conservative setups using only the slowest moving average, or more aggressive entries requiring full alignment of fast, medium, and slow MAs, the system adjusts accordingly. Likewise, exit management offers both static and dynamic methods—such as ATR-based stop losses, Supertrend-based adaptive exits, and partial profit-taking mechanisms—allowing risk to be managed with precision.
This makes the strategy particularly suitable for trend-driven markets, such as major currency pairs, indices, or volatile stocks that demonstrate clear directional moves. It is not ideal for sideways or choppy markets, where multiple filters may reduce the number of trades or result in whipsaws.
From a practical standpoint, the strategy also incorporates real-world trading mechanics, like time-based filters and account risk control, which elevate it from a purely theoretical model to a more execution-ready system.
In summary, this is a well-structured, modular trend strategy ideal for intermediate to advanced traders who want to maintain control over their system parameters while still benefiting from layered signal confirmation. With proper calibration, it has the potential to become a reliable tool in any trader’s arsenal—particularly in markets where trends emerge clearly and sustainably.
FOR MORE INFORMATION VISIT vwolftrading.com

Gyspy Bot Trade Engine - V1.2B - Strategy 12-7-25 - SignalLynxGypsy Bot Trade Engine (MK6 V1.2B) - Ultimate Strategy & Backtest
Brought to you by Signal Lynx | Automation for the Night-Shift Nation 🌙
1. Executive Summary & Architecture
Gypsy Bot (MK6 V1.2B) is not merely a strategy; it is a massive, modular Trade Engine built specifically for the TradingView Pine Script environment. While most strategies rely on a single dominant indicator (like an RSI cross or a MACD flip) to generate signals, Gypsy Bot functions as a sophisticated Consensus Algorithm.
The engine calculates data from up to 12 distinct Technical Analysis Modules simultaneously on every bar closing. It aggregates these signals into a "Vote Count" and only executes a trade entry when a user-defined threshold of concurring signals is met. This "Voting System" acts as a noise filter, requiring multiple independent mathematical models—ranging from volume flow and momentum to cyclical harmonics and trend strength—to agree on market direction before capital is committed.
Beyond entries, Gypsy Bot features a proprietary Risk Management suite called the Dump Protection Team (DPT). This logic layer operates independently of the entry modules, specifically scanning for "Moon" (Parabolic) or "Nuke" (Crash) volatility events to force-exit positions, overriding standard stops to preserve capital during Black Swan events.
2. ⚠️ The Philosophy of "Curve Fitting" (Must Read)
One must be careful when applying Gypsy Bot to new pairs or charts.
To be fully transparent: Gypsy Bot is, by definition, a very advanced curve-fitting engine. Because it grants the user granular control over 12 modules, dozens of thresholds, and specific voting requirements, it is extremely easy to "over-fit" the data. You can easily toggle switches until the backtest shows a 100% win rate, only to have the strategy fail immediately in live markets because it was tuned to historical noise rather than market structure.
To use this engine successfully, you must adopt a specific optimization mindset:
Ignore Raw Net Profit: Do not tune for the highest dollar amount. A strategy that makes $1M in the backtest but has a 40% drawdown is useless.
Prioritize Stability: Look for a high Profit Factor (1.5+), a high Percent Profitable, and a smooth equity curve.
Regular Maintenance is Mandatory: Markets shift regimes (e.g., from Bull Trend to Crab Range). Parameters that worked perfectly in 2021 may fail in 2024. Gypsy Bot settings should be reviewed and adjusted at regular intervals (e.g., quarterly) to ensure the voting logic remains aligned with current market volatility.
Timeframe Recommendations:
Gypsy Bot is optimized for High Time Frame (HTF) trend following. It generally produces the most reliable results on charts ranging from 1-Hour to 12-Hours, with the 4-Hour timeframe historically serving as the "sweet spot" for most major cryptocurrency assets.
3. The Voting Mechanism: How Entries Are Generated
The heart of the Gypsy Bot engine is the ActivateOrders input (found in the "Order Signal Modifier" settings).
The engine constantly monitors the output of all enabled Modules.
Long Votes: GoLongCount
Short Votes: GoShortCount
If you have 10 Modules enabled, and you set ActivateOrders to 7:
The engine will ONLY trigger a Buy Entry if 7 or more modules return a valid "Buy" signal on the same closed candle.
If only 6 modules agree, the trade is rejected.
This allows you to mix "Leading" indicators (Oscillators) with "Lagging" indicators (Moving Averages) to create a high-probability entry signal that requires momentum, volume, and trend to all be in alignment.
4. Technical Deep Dive: The 12 Modules
Gypsy Bot allows you to toggle the following modules On/Off individually to suit the asset you are trading.
Module 1: Modified Slope Angle (MSA)
Logic: Calculates the geometric angle of a moving average relative to the timeline.
Function: It filters out "lazy" trends. A trend is only considered valid if the slope exceeds a specific steepness threshold. This helps avoid entering trades during weak drifts that often precede a reversal.
Module 2: Correlation Trend Indicator (CTI)
Logic: Based on John Ehlers' work, this measures how closely the current price action correlates to a straight line (a perfect trend).
Function: It outputs a confidence score (-1 to 1). Gypsy Bot uses this to ensure that we are not just moving up, but moving up with high statistical correlation, reducing fake-outs.
Module 3: Ehlers Roofing Filter
Logic: A sophisticated spectral filter that combines a High-Pass filter (to remove long-term drift) with a Super Smoother (to remove high-frequency noise).
Function: It attempts to isolate the "Roof" of the price action. It is excellent at catching cyclical turning points before standard moving averages react.
Module 4: Forecast Oscillator
Logic: Uses Linear Regression forecasting to predict where price "should" be relative to where it is.
Function: When the Forecast Oscillator crosses its zero line, it indicates that the regression trend has flipped. We offer both "Aggressive" and "Conservative" calculation modes for this module.
Module 5: Chandelier ATR Stop
Logic: A volatility-based trend follower that hangs a "leash" (ATR multiple) from the highest high (for longs) or lowest low (for shorts).
Function: Used here as an entry filter. If price is above the Chandelier line, the trend is Bullish. It also includes a "Bull/Bear Qualifier" check to ensure structural support.
Module 6: Crypto Market Breadth (CMB)
Logic: This is a macro-filter. It pulls data from multiple major tickers (BTC, ETH, and Perpetual Contracts) across different exchanges.
Function: It calculates a "Market Health" percentage. If Bitcoin is rising but the rest of the market is dumping, this module can veto a trade, ensuring you don't buy into a "fake" rally driven by a single asset.
Module 7: Directional Index Convergence (DIC)
Logic: Analyzes the convergence/divergence between Fast and Slow Directional Movement indices.
Function: Identifies when trend strength is expanding. A buy signal is generated only when the positive directional movement overpowers the negative movement with expanding momentum.
Module 8: Market Thrust Indicator (MTI)
Logic: A volume-weighted breadth indicator. It uses Advance/Decline data and Up/Down Volume data.
Function: This is one of the most powerful modules. It confirms that price movement is supported by actual volume flow. We recommend using the "SSMA" (Super Smoother) MA Type for the cleanest signals on the 4H chart.
Module 9: Simple Ichimoku Cloud
Logic: Traditional Japanese trend analysis using the Tenkan-sen and Kijun-sen.
Function: Checks for a "Kumo Breakout." Price must be fully above the Cloud (for longs) or below it (for shorts). This is a classic "trend confirmation" module.
Module 10: Simple Harmonic Oscillator
Logic: Analyzes the harmonic wave properties of price action to detect cyclical tops and bottoms.
Function: Serves as a counter-trend or early-reversal detector. It tries to identify when a cycle has bottomed out (for buys) or topped out (for sells) before the main trend indicators catch up.
Module 11: HSRS Compression / Super AO
Logic: Two options in one.
HSRS: Hirashima Sugita Resistance Support. Detects volatility compression (squeezes) relative to dynamic support/resistance bands.
Super AO: A combination of the Awesome Oscillator and SuperTrend logic.
Function: Great for catching explosive moves that result from periods of low volatility (consolidation).
Module 12: Fisher Transform (MTF)
Logic: Converts price data into a Gaussian normal distribution.
Function: Identifies extreme price deviations. This module uses Multi-Timeframe (MTF) logic to look at higher-timeframe trends (e.g., looking at the Daily Fisher while trading the 4H chart) to ensure you aren't trading against the major trend.
5. Global Inhibitors (The Veto Power)
Even if 12 out of 12 modules vote "Buy," Gypsy Bot performs a final safety check using Global Inhibitors. If any of these are triggered, the trade is blocked.
Bitcoin Halving Logic:
Hardcoded dates for past and projected future Bitcoin halvings (up to 2040).
Trading is inhibited or restricted during the chaotic weeks immediately surrounding a Halving event to avoid volatility crushes.
Miner Capitulation:
Uses Hash Rate Ribbons (Moving averages of Hash Rate).
If miners are capitulating (Shutting down rigs due to unprofitability), the engine flags a "Bearish" regime and can flip logic to Short-only or flat.
ADX Filter (Flat Market Protocol):
If the Average Directional Index (ADX) is below a specific threshold (e.g., 20), the market is deemed "Flat/Choppy." The bot will refuse to open trend-following trades in a flat market.
CryptoCap Trend:
Checks the total Crypto Market Cap chart. If the broad market is in a downtrend, it can inhibit Long entries on individual altcoins.
6. Risk Management & The Dump Protection Team (DPT)
Gypsy Bot separates "Entry Logic" from "Risk Management Logic."
Dump Protection Team (DPT)
This is a specialized logic branch designed to save the account during Black Swan events.
Nuke Protection: If the DPT detects a volatility signature consistent with a flash crash, it overrides all other logic and forces an immediate exit.
Moon Protection: If a parabolic pump is detected that violates statistical probability (Bollinger deviations), DPT can force a profit take before the inevitable correction.
Advanced Adaptive Trailing Stop (AATS)
Unlike a static trailing stop (e.g., "trail by 5%"), AATS is dynamic.
Penthouse Level: If price is at the top of the HSRS channel (High Volatility), the stop loosens to allow for wicks.
Dungeon Level: If price is compressed at the bottom, the stop tightens to protect capital.
Staged Take Profits
TP1: Scalp a portion (e.g., 10%) to cover fees and secure a win.
TP2: Take the bulk of profit.
TP3: Leave a "Runner" position with a loose trailing stop to catch "Moon" moves.
7. Recommended Setup Guide
When applying Gypsy Bot to a new chart, follow this sequence:
Set Timeframe: 4 Hours (4H).
Reset: Turn OFF Trailing Stop, Stop Loss, and Take Profits. (We want to see raw entry performance first).
Tune DPT: Adjust "Dump/Moon Protection" inputs first. These have the highest impact on net performance.
Tune Module 8 (MTI): This module is a heavy filter. Experiment with the MA Type (SSMA is recommended).
Select Modules: Enable/Disable modules 1-12 based on the asset's personality (Trending vs. Ranging).
Voting Threshold: Adjust ActivateOrders. A lower number = More Trades (Aggressive). A higher number = Fewer, higher conviction trades (Conservative).
Final Polish: Re-enable Stop Losses, Trailing Stops, and Staged Take Profits to smooth the equity curve and define your max risk per trade.
8. Technical Specs
Engine Version: Pine Script V6
Repainting: This strategy uses Closed Candle data for all Risk Management and Entry decisions. This ensures that Backtest results align closely with real-time behavior (no repainting of historical signals).
Alerts: This script generates Strategy alerts. If you require visual-only alerts, see the source code header for instructions on switching to "Study" (Indicator) mode.
Disclaimer:
This script is a complex algorithmic tool for market analysis. Past performance is not indicative of future results. Use this tool to assist your own decision-making, not to replace it.
9. About Signal Lynx
Automation for the Night-Shift Nation 🌙
Signal Lynx focuses on helping traders and developers bridge the gap between indicator logic and real-world automation. The same RM engine you see here powers multiple internal systems and templates, including other public scripts like the Super-AO Strategy with Advanced Risk Management.
We provide this code open source under the Mozilla Public License 2.0 (MPL-2.0) to:
Demonstrate how Adaptive Logic and structured Risk Management can outperform static, one-layer indicators
Give Pine Script users a battle-tested RM backbone they can reuse, remix, and extend
If you are looking to automate your TradingView strategies, route signals to exchanges, or simply want safer, smarter strategy structures, please keep Signal Lynx in your search.
License: Mozilla Public License 2.0 (Open Source).
If you make beneficial modifications, please consider releasing them back to the community so everyone can benefit.

VWolf - Quantum DriftOVERVIEW
The Quantum Drift strategy is a sophisticated, highly customizable trading approach designed to identify market entries and exits by leveraging multiple technical indicators. The strategy uniquely combines the Dynamic Exponential Moving Average (DEMA), QQE indicators, Volume Oscillator, and Hull Moving Average (HULL), enabling precise detection of trend direction, momentum shifts, and volatility adjustments. It stands out due to its adaptability across different market conditions by allowing significant user customization through various input parameters.
RECOMMENDED USE
Markets: Ideal for Forex and Stocks due to the strategy's volatility-sensitive and trend-following nature.
Timeframes: Best suited for medium to higher timeframes (15m, 1H, 4H), where clearer trend signals and less noise occur, enhancing strategy reliability.
CONCLUSION
The Quantum Drift strategy is tailored for intermediate to advanced traders seeking a versatile and adaptive system. Its strength lies in combining momentum, volatility, and trend-following components, providing robust entry and exit signals. However, its effectiveness relies significantly on accurate parameter tuning by traders familiar with the underlying indicators and market behavior.
FOR MORE INFORMATION VISIT vwolftrading.com

VWolf – Momentum TwinOVERVIEW
VWolf – Momentum Twin is designed to identify high-probability momentum reversals emerging from overbought or oversold market conditions. It employs a double confirmation from the Stochastic RSI oscillator, optionally filtered by trend and directional movement conditions, before executing trades.
The strategy emphasizes consistent risk management by scaling stop-loss and take-profit targets according to market volatility (ATR), and it provides advanced position management features such as partial profit-taking and automated stop-loss adjustments.
RECOMMENDED USE
Markets: Major FX pairs, index futures, large-cap stocks, and top-volume cryptocurrencies.
Timeframes: Best suited for M15–H4; adaptable for swing trading on daily charts.
Trader Profile: Traders who value structured, volatility-adjusted momentum reversal setups.
Strengths:
Double confirmation filters out many false signals.
Multiple filter options allow strategic flexibility.
ATR scaling maintains consistent risk across assets.
Trade management tools improve adaptability in dynamic markets.
Precautions:
May produce fewer trades in strong one-direction trends.
Over-filtering can reduce trade frequency.
Requires validation across instruments and timeframes before deployment.
CONCLUSION
The VWolf – Momentum Twin offers a disciplined framework for capturing momentum reversals while preserving flexibility through its customizable filters and risk controls. Its double confirmation logic filters out a significant portion of false reversals, while ATR-based scaling ensures consistency across varying market conditions. The optional trade management features, including partial profit-taking and automatic stop adjustments, allow the strategy to adapt to both trending and ranging environments. This makes it a versatile tool for traders who value structured entries, robust risk control, and adaptable management in a variety of markets and timeframes.
