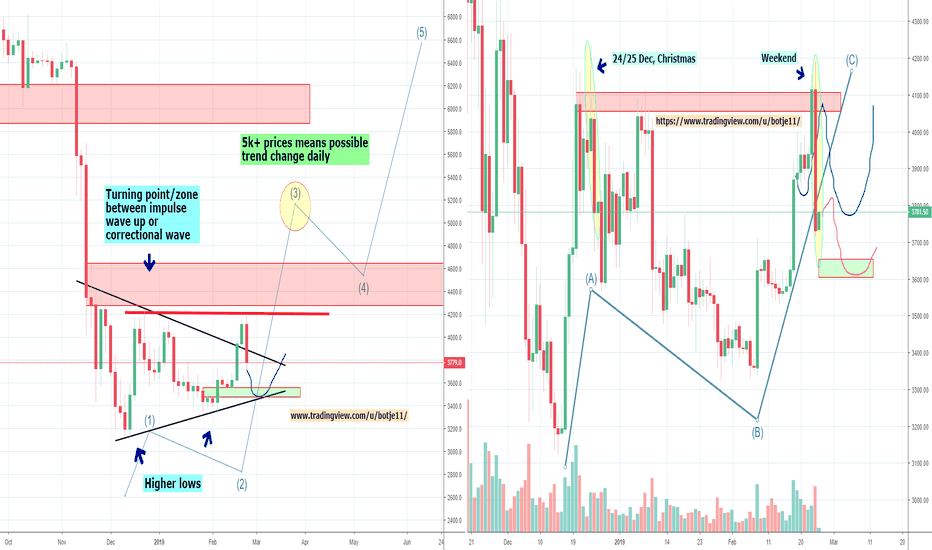
Bitcoin December Rally Fractal Still in Play

We are still moving according to that Dec fractal, when we had a similar drop (in size). Since it is moving sideways again, i am going to zoom in with my analysis until we see a break of the 3700/3850 range. It is still most likely to see another drop before we move up again, but a good strong break of 3850 could change that. Normally the chances to move up again, before making a lower low first, is like 20%. However, the longer this takes, the bigger those chances become. Because it is almost starting to look like it doesn't want to drop. Increasing the chances for a double bottom.
So even if we see a drop to 3700ish, but see a big bounce from that level, the double bottom could be real. But be aware, in Dec it also looked like a good double bottom, but it was unable to break that red resistance.
Short term, we have a resistance at 3810/3820, if that breaks, we could see something happen. On the low side we have a support around 3770/60.
So the bigger range is 3700/3850, the range inside of that is 3820/3770.
For the bigger picture view, please read my previous analysis.
Previous analysis:

Note
Moving up again like nothing happened, The drop was expected, but not seeing it move up this fast again. The fractal showed a possible move up, but only after finding support first. Now it seems like the support was already waiting and based on the bounce, too many people were waiting to buy (or close shorts). If this continues like this, getting above the 3800/20 within a few hours, it would become likely the correction is already over.
Note
Don't think i have seen a move (a bounce) like this in a very long time. Talking about maybe even half a year. But correct me if i am wrong, normally i remember these things, but really can't think of a moment we had a bounce like this latelyNote
Now it seems to be slowing down, but still very stable. ETH made another small jump. Both we can see the levels to break now (red zones). A good 4H candle close above those levels is normally a buy signal. I looked back quickly, but i have i could not find a move like this the past months. If anyone does, please tell me.Note
Still stable, still all small bull flags. If the bulls keep this up, move towards these big resistance levels, we could see a (small) short squeeze happen. These highs, are levels were many people shorted the past days. So, the ones who were not able to get out, wil start to buy back there, increasing the buying pressure, which can trigger more stops. So it will be important to see what happens.Note
Just had another attempt to break up, but it is getting barted down now. this is not good. Need to see a higher low now, otherwise yesterday's move will be a complete failure.Damn, Bitmex bulls just bought it all up again (ETH), i have a special chart in my channel where you can see that. just wondering if it is not a miss click maybe, cause it makes no sense,
Note
Bit weird past hour, because it looks like ETH traders are doing their best to push it down, while BTC traders try to push up. I can't say which one we should look at now. A lot of noise at this point. Bitcoin was about to break the resistance, while ETH was not even close yet. Also with this drop just now, ETH dropped to 134 and out of nowhere a big market buy to 137. So i think there is a big fight going on now.
Clause de non-responsabilité
Les informations et les publications ne sont pas destinées à être, et ne constituent pas, des conseils ou des recommandations en matière de finance, d'investissement, de trading ou d'autres types de conseils fournis ou approuvés par TradingView. Pour en savoir plus, consultez les Conditions d'utilisation.
