OPEN-SOURCE SCRIPT
Volume Indıcator [JP & Dia]
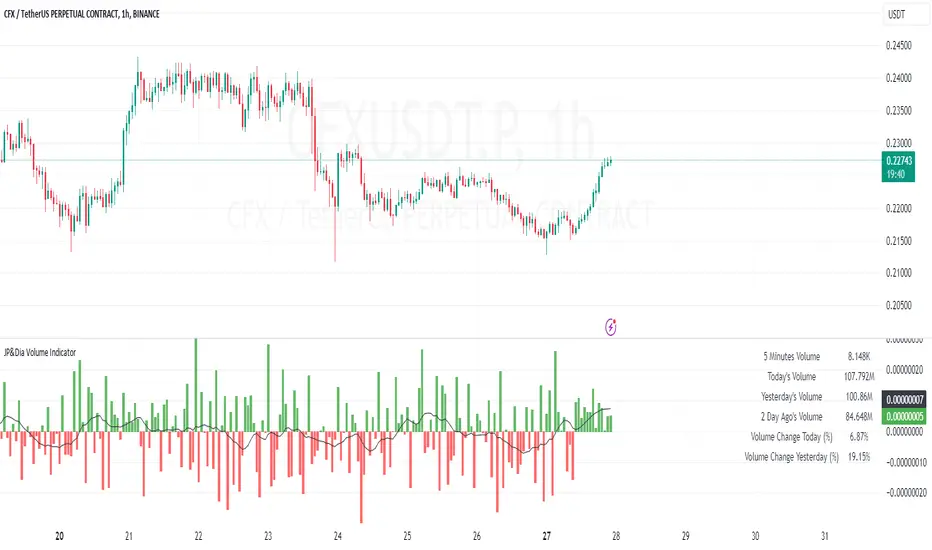
The volume indicator refers to the total amount of a financial instrument that has been traded within a specific time frame. This can include shares, contracts, or lots. Market exchanges track and provide this data. The volume indicator is one of the oldest and most widely used indicators in trading. It is typically represented by colored columns, with green indicating up volume and red indicating down volume, along with a moving average. Unlike other indicators, the volume indicator is not based on price. A high volume suggests a strong interest in a particular instrument at its current price, while a low volume suggests the opposite.
When there is a sudden increase in trading volume, it indicates a higher likelihood of the price changing. This often occurs during news events. Strong trending movements are often accompanied by increased trading volume, which can be seen as a measure of strength. Traders would typically expect to see high buying volume at a support level and high selling volume at a resistance level. There are various ways to incorporate volume into a trading strategy, and many traders combine it with other analysis techniques.
USECASE :
Timeframe Selection: Choose the timeframe for which you want to analyze the volume.
Volume Display Options: Toggle the display of today’s, yesterday’s, and the day before yesterday’s volume data.
Text Color: Select the color for the text in the volume table.
Volume Data Retrieval: The script fetches volume data for the selected timeframe and the daily volume for the current and previous two days.
Percentage Change Calculation: Calculates the percentage change in volume between days to identify significant increases or decreases.
Volume Table: A table is created to display the volume data and percentage changes, updating in real-time with each new bar.
Script open-source
Dans le plus pur esprit TradingView, l'auteur de ce script l'a publié en open-source, afin que les traders puissent le comprendre et le vérifier. Bravo à l'auteur! Vous pouvez l'utiliser gratuitement, mais la réutilisation de ce code dans des publications est régie par nos Règles. Vous pouvez le mettre en favori pour l'utiliser sur un graphique.
Vous voulez utiliser ce script sur un graphique ?
Clause de non-responsabilité
Les informations et les publications ne sont pas destinées à être, et ne constituent pas, des conseils ou des recommandations en matière de finance, d'investissement, de trading ou d'autres types de conseils fournis ou approuvés par TradingView. Pour en savoir plus, consultez les Conditions d'utilisation.