OPEN-SOURCE SCRIPT
Mis à jour Rsi/Cci Overbought Oversold Candles

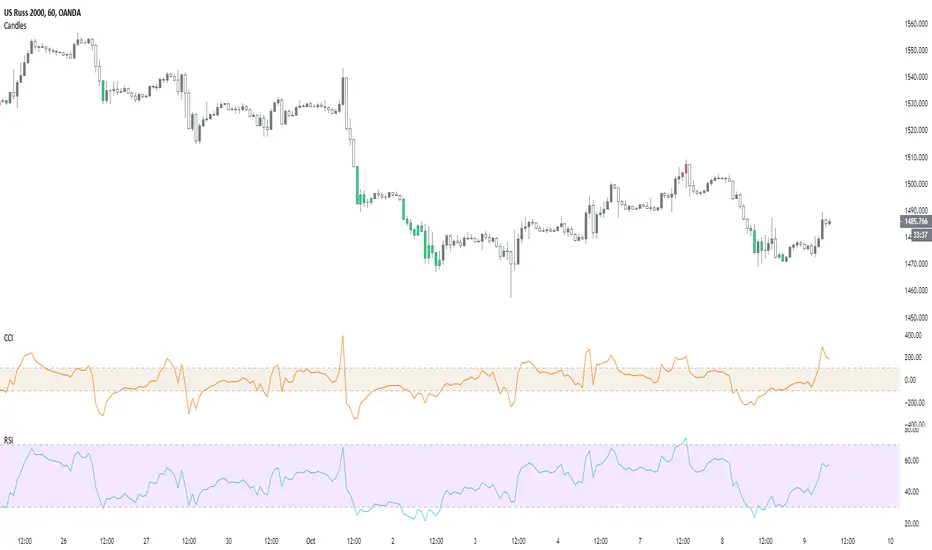
This indicator will allow you to see overbought and oversold areas of the rsi or the cci, you must set yourself the upper and lower band of the rsi (70-30) or cci (100, -100). By default, it's Rsi
I have already posted the same indicator but only with the Rsi, I wanted to posted a more complete that offers the 2.
On the chart, it is the overbought / oversold area of the Cci that is displayed
I have already posted the same indicator but only with the Rsi,

On the chart, it is the overbought / oversold area of the Cci that is displayed
Notes de version
I have the time to update the code, the latter was falsifying the result, now everything works, to get the overbought / oversold areas of the CCI, you have to tick the box and enter the values of the top and the bottom manually, same for the RSI, by default, the result is that of the RSINotes de version
Update to V4Clause de non-responsabilité
Les informations et les publications ne sont pas destinées à être, et ne constituent pas, des conseils ou des recommandations en matière de finance, d'investissement, de trading ou d'autres types de conseils fournis ou approuvés par TradingView. Pour en savoir plus, consultez les Conditions d'utilisation.