OPEN-SOURCE SCRIPT
Mis à jour Multi-timeframe Stochastic RSI
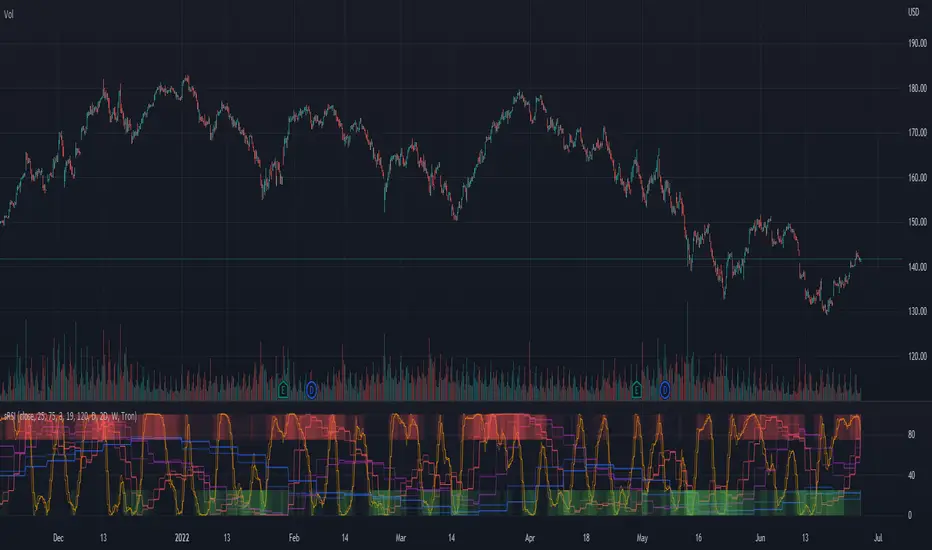
The multi-timeframe stochastic RSI utilizes stochastic RSI signals from 11 different time-frames to indicate whether overbought/oversold signals are in agreement or not across time-frames. Ideally traders should enter and exit when conditions are in agreement as indicated by the intensity of the long (green) or short (red) bands at the top and bottom of the indicator. The intensity of the bands indicates how many of the time-frames are currently overbought/oversold.
Notes de version
Updated script so that it auto adjust to the chart time-frame. Notes de version
Script now auto-adjusts the time-frames used in the oversold and overbought regions as well as the time-frames displayed to the timeframe of the chart.Selecting "manual sRSI" allows you to adjust the time-frames displayed, but not the timeframes used for the oversold and overbought regions.
Selecting "I have free TV" adjusts the chart to only use the basic timeframes.
Minor edits to retain original functionality: Select "I have free TV" and "Manual sRSI" for v1 behavior.
Script open-source
Dans l'esprit TradingView, le créateur de ce script l'a rendu open source afin que les traders puissent examiner et vérifier ses fonctionnalités. Bravo à l'auteur! Bien que vous puissiez l'utiliser gratuitement, n'oubliez pas que la republication du code est soumise à nos Règles.
Clause de non-responsabilité
Les informations et publications ne sont pas destinées à être, et ne constituent pas, des conseils ou recommandations financiers, d'investissement, de trading ou autres fournis ou approuvés par TradingView. Pour en savoir plus, consultez les Conditions d'utilisation.