OPEN-SOURCE SCRIPT
Mis à jour Function Polynomial Regression Strategy

To be clear I'm using the code from Richard Santos for the functional polynomial regression. I really loved his script idea (given that I'm into linear regression myself). I took his code and made a strategy which applies to bitcoin on the 5 minute chart (but you could adjust this for any asset), and you could make this work on anytime frame by adjusting the 'length' property of the regression until you get good results.
This strategy is very simple.
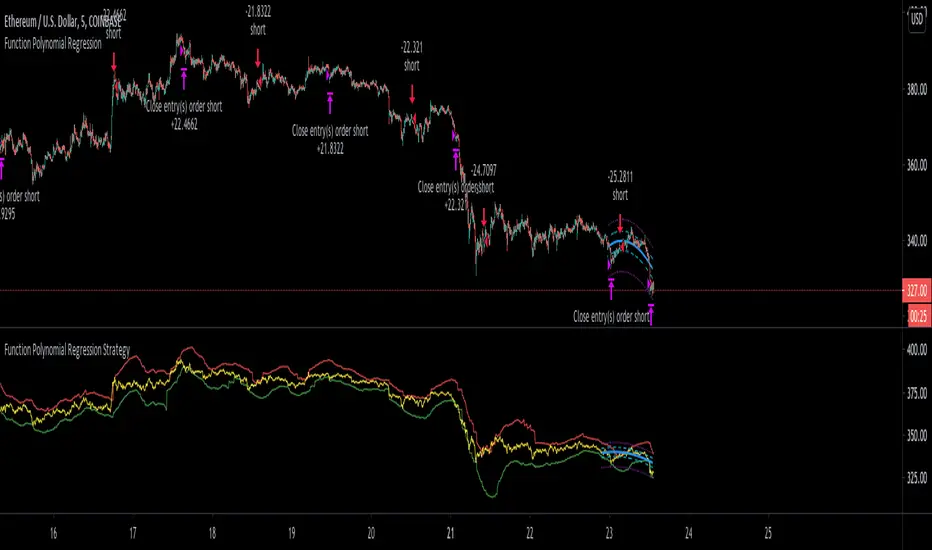
I drew lines to represent the bottom most part of the regression (green line), and top most part (red line). If the close crosses under the red line then you short. The reverse if it crosses above the green line then you go long.
Very simple but effective. To understand this script be sure to add Richard santos function polynomial regression so you can see what is going on and what I'm trying to do.
For example, on BTC with a length of 61 if you bought and held you would have only had 5% gain, instead with this strategy you are looking at very close to 60% gains! Now this could be a weird fluke of over-optimizing but I'm not sure this is the case because you can adjust the length from there +/- about 10 and still have good results. It's just certain lengths are the correct trading rhythms for different assets.
I'm excited to see how you guys use this and if you have any success. Be sure to thank Richard Santos for his great work!
Notes de version
I added trailing stop loss as requested by some users just enable it in the settings with the gear icon. By default I have it turned off, but with ETHUSD you can see that it can create improvements with the right settings. Just tweak it until you find the right settings.Notes de version
I added backtest date range and the ability to:- Do only LONGS
- Do only SHORTS
- Close instead of Short
- Close instead of Long
In the example uploaded, you can see that by turning off allowLongs, and enabling close instead of long you can see how effective this strategy is with just shorting alone. Using this you can optimize your parameters for just shorting or longing and then combine them later for the best settings.
Thanks to investCHK for the suggestion!
Script open-source
Dans l'esprit TradingView, le créateur de ce script l'a rendu open source afin que les traders puissent examiner et vérifier ses fonctionnalités. Bravo à l'auteur! Bien que vous puissiez l'utiliser gratuitement, n'oubliez pas que la republication du code est soumise à nos Règles.
-=Gentleman Goat=- Download the TradingView Input Optimizer at tradingtools.software/optimizer
Discord: discord.gg/pGHHRczpbu
Discord: discord.gg/pGHHRczpbu
Clause de non-responsabilité
Les informations et publications ne sont pas destinées à être, et ne constituent pas, des conseils ou recommandations financiers, d'investissement, de trading ou autres fournis ou approuvés par TradingView. Pour en savoir plus, consultez les Conditions d'utilisation.