OPEN-SOURCE SCRIPT
Mis à jour Historic High Lows Adaptive
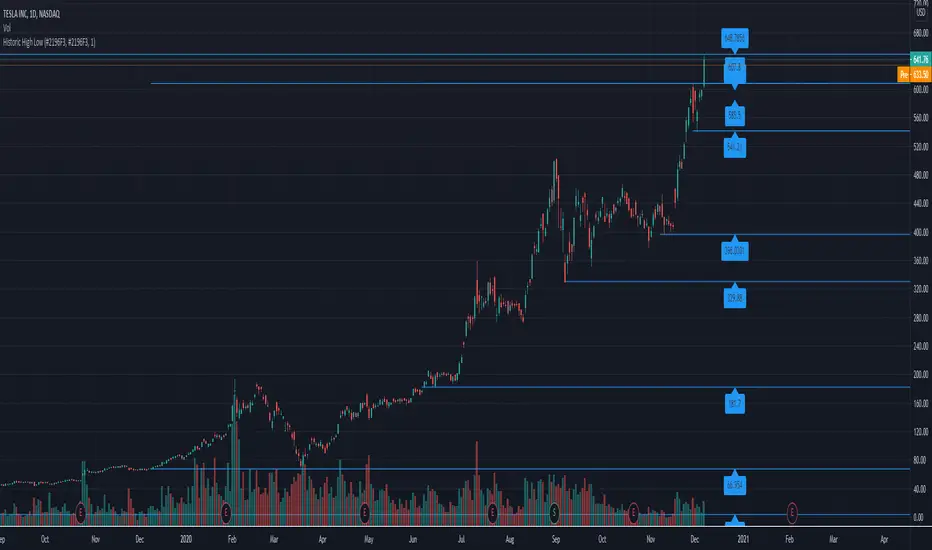
This will plot in the ticker opened:
-All-time High and Low
-1 Year High and Low
-6 Months High and Low
-3 Months High and Low
-1 Month High and Low
-1 Week High and Low
-Previous day High and Low
Colors, extending the line to the right, width, showing price tag are all parameters.
High and Low calculations are updated daily
Lines haves issues sometimes rendering when the candles are in a period too small.
Notes de version
Updated Script to fix issue where lines would be redrawn if a high or low are made on intraday. It should now only look at the past dates and prevent the line from redrawing till the next day.Script open-source
Dans l'esprit TradingView, le créateur de ce script l'a rendu open source afin que les traders puissent examiner et vérifier ses fonctionnalités. Bravo à l'auteur! Bien que vous puissiez l'utiliser gratuitement, n'oubliez pas que la republication du code est soumise à nos Règles.
Clause de non-responsabilité
Les informations et publications ne sont pas destinées à être, et ne constituent pas, des conseils ou recommandations financiers, d'investissement, de trading ou autres fournis ou approuvés par TradingView. Pour en savoir plus, consultez les Conditions d'utilisation.
Script open-source
Dans l'esprit TradingView, le créateur de ce script l'a rendu open source afin que les traders puissent examiner et vérifier ses fonctionnalités. Bravo à l'auteur! Bien que vous puissiez l'utiliser gratuitement, n'oubliez pas que la republication du code est soumise à nos Règles.
Clause de non-responsabilité
Les informations et publications ne sont pas destinées à être, et ne constituent pas, des conseils ou recommandations financiers, d'investissement, de trading ou autres fournis ou approuvés par TradingView. Pour en savoir plus, consultez les Conditions d'utilisation.