OPEN-SOURCE SCRIPT
Mis à jour OBV w/BB+EMA

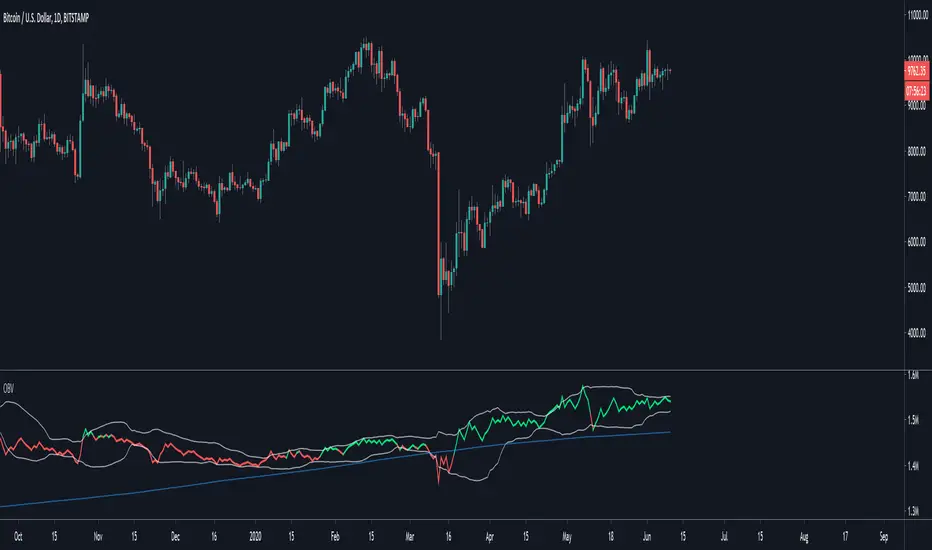
OBV plotted with Bollinger Bands to show whether the volume is breaking out from its normal deviation (both up or down). The OBV changes color depending on the macro trend which is set using a 100 EMA.
Notes de version
MULTIPLE EXCHANGE DATA UPDATE:- Now with the added feature of pulling data from multiple exchanges (for BTCUSD) and calculating a simple average. The following pairs used are: BITSTAMP:BTCUSD, BINANCE:BTCUSDT, COINBASE:BTCUSD, BITFINEX:BTCUSD and KRAKEN:BTCUSD. This feature is off by default
- There is also an option to disable Binance Data for the option above, as it has no data pre Aug 2017
- You can now select the timeframe you would like the OBV to be calculated with (Daily is default)
Notes de version
Alterations to the codeScript open-source
Dans l'esprit de TradingView, le créateur de ce script l'a rendu open-source, afin que les traders puissent examiner et vérifier sa fonctionnalité. Bravo à l'auteur! Vous pouvez l'utiliser gratuitement, mais n'oubliez pas que la republication du code est soumise à nos Règles.
Pour un accès rapide sur un graphique, ajoutez ce script à vos favoris - en savoir plus ici.
Clause de non-responsabilité
Les informations et les publications ne sont pas destinées à être, et ne constituent pas, des conseils ou des recommandations en matière de finance, d'investissement, de trading ou d'autres types de conseils fournis ou approuvés par TradingView. Pour en savoir plus, consultez les Conditions d'utilisation.
Script open-source
Dans l'esprit de TradingView, le créateur de ce script l'a rendu open-source, afin que les traders puissent examiner et vérifier sa fonctionnalité. Bravo à l'auteur! Vous pouvez l'utiliser gratuitement, mais n'oubliez pas que la republication du code est soumise à nos Règles.
Pour un accès rapide sur un graphique, ajoutez ce script à vos favoris - en savoir plus ici.
Clause de non-responsabilité
Les informations et les publications ne sont pas destinées à être, et ne constituent pas, des conseils ou des recommandations en matière de finance, d'investissement, de trading ou d'autres types de conseils fournis ou approuvés par TradingView. Pour en savoir plus, consultez les Conditions d'utilisation.