Wig20 Sentiment
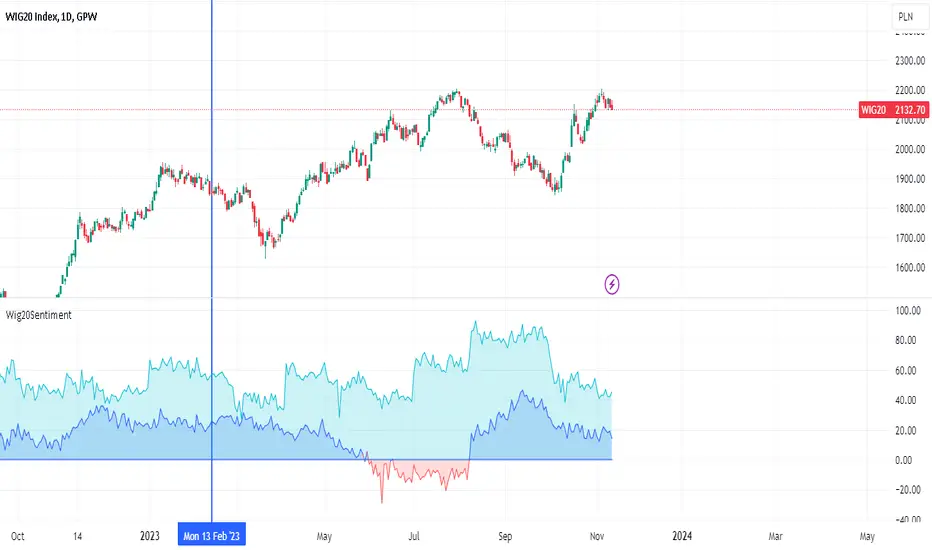
Wig20 Sentiment script is merging data from different Wig20 contract sources and calculates constant sentiment prediction for +2 months and +9 months.
This script can be used by ANY user. You DO NOT NEED to have PRO or PREMIUM account to use it.
This script is a part of a bigger package called "Wig20". In that package we have:
Wig20 Volume - Chart showing volume/cash flow on Wig20 index.
Wig20 Volume Stats - Volume statistics compared with similar periods in history.
Wig20 Sentiment - Wig20 sentiment in +2 and +9 months time period.
Wig20 Expectation - Wig20 expectations in +2 and +9 months time period.
Wig20 Impact - Script showing expected impact of price change of particular instrument on the Wig20 index.
Script settings:
Sentiment +2m - Settings for chart showing +2m Wig20:
Visibility - Checkbox to show/hide +2m sentiment
* Up - Colors for line and area fill when sentiment is positive
* Down - Colors for line and area fill when sentiment is negative
Sentiment +9m - Settings for chart showing +9m Wig20:
Visibility - Checkbox to show/hide +9m sentiment
* Up - Colors for line and area fill when sentiment is positive
* Down - Colors for line and area fill when sentiment is negative
Contract expiration dates - Hiding/showing contact expiration dates as lines on the chart.
Checking time offset - Checking bar time offset (Checking if bar hours are starting at :00 minutes). In case of some charts quotations are shifted what will affect the chart shape.
Troubleshooting:
In case of any problems, send error details to the author of the script.
Script sur invitation seulement
Seuls les utilisateurs approuvés par l'auteur peuvent accéder à ce script. Vous devrez demander et obtenir l'autorisation pour l'utiliser. Celle-ci est généralement accordée après paiement. Pour plus de détails, suivez les instructions de l'auteur ci-dessous ou contactez directement Investor_R.
TradingView ne recommande PAS d'acheter ou d'utiliser un script à moins que vous ne fassiez entièrement confiance à son auteur et que vous compreniez son fonctionnement. Vous pouvez également trouver des alternatives gratuites et open source dans nos scripts communautaires.
Instructions de l'auteur
More details on Website and Youtube.
Clause de non-responsabilité
Script sur invitation seulement
Seuls les utilisateurs approuvés par l'auteur peuvent accéder à ce script. Vous devrez demander et obtenir l'autorisation pour l'utiliser. Celle-ci est généralement accordée après paiement. Pour plus de détails, suivez les instructions de l'auteur ci-dessous ou contactez directement Investor_R.
TradingView ne recommande PAS d'acheter ou d'utiliser un script à moins que vous ne fassiez entièrement confiance à son auteur et que vous compreniez son fonctionnement. Vous pouvez également trouver des alternatives gratuites et open source dans nos scripts communautaires.
Instructions de l'auteur
More details on Website and Youtube.