OPEN-SOURCE SCRIPT
Risk Reward
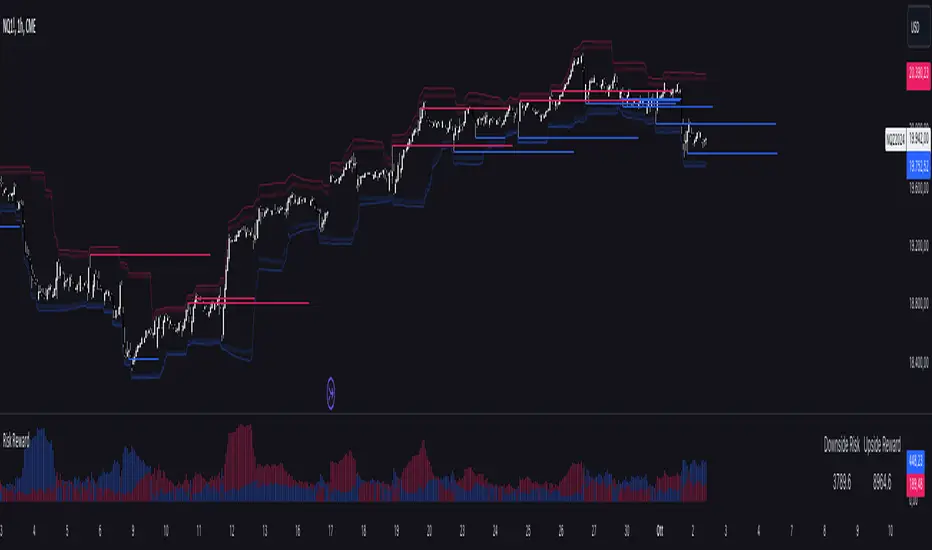
The Risk Reward indicator, developed by OmegaTools, is a versatile technical tool designed to help traders visualize and evaluate potential reward and risk levels in their trades. By comparing recent price action against moving averages and volatility deviations, it calculates a range-weighted assessment of upside reward and downside risk. It provides a clear, color-coded visual representation of these potential ranges, along with critical support and resistance levels to aid in trade decision-making. This indicator is ideal for traders seeking to optimize their risk-reward ratio and make informed trade management decisions.
Features
Reward and Risk Visualization: Provides a histogram showing the relative potential of upside reward versus downside risk based on current price action.
Dynamic Support and Resistance Levels: Calculates and plots key price levels based on extreme of historical volatility, helping traders to identify important price zones.
Trade Size Customization: Users can adjust the trade size, and the indicator will calculate and display the estimated risk and reward in monetary terms based on the contract value.
Adaptive Volatility Extensions: Automatically adjusts extension lines based on volume, helping traders anticipate future price ranges and potential breakouts or breakdowns.
Customizable Visuals: Allows users to personalize the color scheme for bullish and bearish scenarios, making the chart more intuitive and user-friendly.
User Guide
Trade Size (size): Adjust the trade size in units (default is 1). This parameter impacts the risk and reward calculation shown in the summary table.
Length (lnt): Set the length for the exponential moving average (EMA) and the highest/lowest price calculations. This length determines the sensitivity of the indicator.
Different Visual (down): A boolean input to adjust the method for calculating downside risk. When set to true, it uses a different visual scheme.
Bullish Color (upc): Customize the color of the bullish (upside) histogram and support levels.
Bearish Color (dnc): Customize the color of the bearish (downside) histogram and resistance levels.
Plots
First Probability: Displays a histogram representing the higher value between reward and risk. It is colored according to whether the upside or downside is greater, providing a clear signal for potential trade direction.
Second Probability: A secondary histogram plot that visualizes the lower value between reward and risk, offering an additional perspective on the trade’s risk-reward balance.
Low Level/High Level: Displays dynamic support and resistance levels based on historical price data and volatility deviations.
Extension Lines: Visualize potential future price levels using volatility-adjusted projections. These lines help traders anticipate where price could move based on current conditions.
On-Chart Labels and Risk-Reward Table:
Risk and Reward Calculations: The indicator calculates the monetary value of downside risk and upside reward based on the provided trade size, volatility measures, and price movements.
Risk/Reward Table: Displayed directly on the chart, showing the downside risk and upside reward in easy-to-understand numerical values. This helps traders quickly assess the feasibility of a trade.
How It Works:
Moving Average Comparison: The indicator first calculates the 21-period (default) exponential moving average (EMA). It then compares the current price against this moving average to determine whether the market is in a bullish or bearish phase.
Deviation Calculation: It calculates the average deviation between the price and the EMA for both bullish and bearish movements, which is used to establish dynamic support and resistance levels.
Risk-Reward Calculation: Based on the highest and lowest price levels over the set period and the calculated deviations, it determines the potential upside reward and downside risk. The reward is calculated as the distance between the current price and the upper resistance levels, while the risk is determined as the distance to the lower support levels.
Visual Representation
The indicator plots histograms representing the relative magnitude of potential reward and risk.
Support and resistance levels are dynamically plotted on the chart using circles and lines, helping traders easily spot key areas of interest.
Extension lines are drawn to visualize potential future price levels based on current volatility.
Risk/Reward Table: This feature displays the calculated monetary risk and reward based on the trade size. It updates dynamically with price changes, offering a constant reference point for traders to evaluate their trade setup.
Practical Application
Identify Entry Points: Use the dynamic support and resistance levels to identify ideal trade entry points. The histogram helps determine whether the potential reward justifies the risk.
Risk Management: The calculated downside risk provides traders with an objective view of where to place stop-loss levels, while the upside reward aids in setting profit targets.
Trade Execution: By visually assessing whether reward outweighs risk, traders can make more informed decisions on trade execution, with the risk-reward ratio clearly displayed on the chart.
Best Practices:
Use Alongside Other Indicators: While this indicator offers a powerful standalone tool for assessing risk and reward, it works best when combined with other trend or momentum indicators for confirmation.
Adjust Inputs Based on Market Conditions: Adjust the length and trade size inputs depending on the asset being traded and the time horizon, as different assets may require different sensitivity settings.
Script open-source
Dans l'esprit TradingView, le créateur de ce script l'a rendu open source afin que les traders puissent examiner et vérifier ses fonctionnalités. Bravo à l'auteur! Bien que vous puissiez l'utiliser gratuitement, n'oubliez pas que la republication du code est soumise à nos Règles.
Clause de non-responsabilité
Les informations et publications ne sont pas destinées à être, et ne constituent pas, des conseils ou recommandations financiers, d'investissement, de trading ou autres fournis ou approuvés par TradingView. Pour en savoir plus, consultez les Conditions d'utilisation.