OPEN-SOURCE SCRIPT
Mis à jour India market cap and smart data
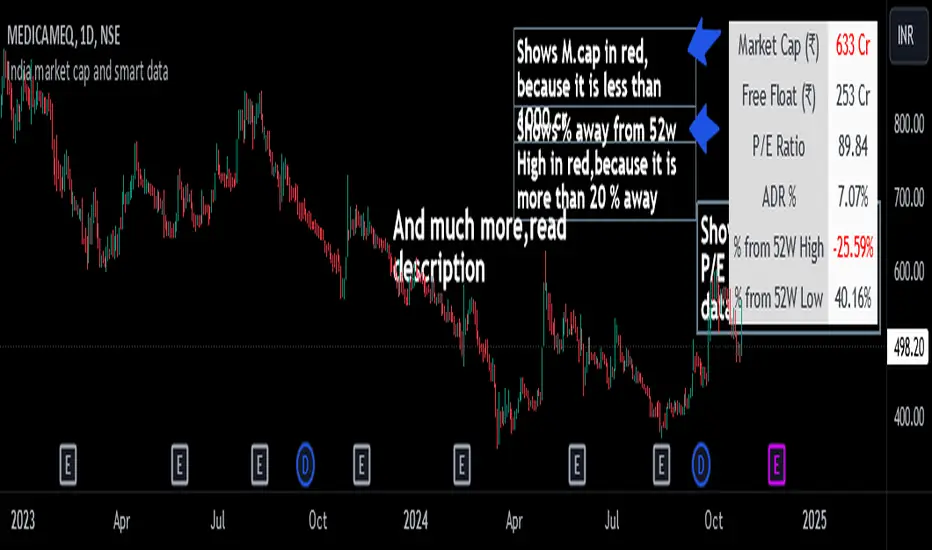
This indicator displays important financial and technical data, such as Market Cap, P/E Ratio, ADR %, etc.
It is specially designed for swing traders.
Key Features and Highlights
- Market Cap Alert: If the Market Cap of a stock is below 1000 crore, it is displayed in red to indicate a potential liquidity issue.
- P/E Ratio for Loss-Making Companies: For companies with net losses, the P/E ratio is shown as 0 and displayed in red, alerting you to the unprofitable status of the company.
- ADR Alert: When the ADR is below 4%, it is highlighted in red. Swing traders typically look for stocks with high ADR.
- 52-Week High Proximity: If a stock is more than 20% below its 52-week high, this data is shown in red.
- 52-Week Low Performance: If a stock is up by more than 70% from its 52-week low, the data is displayed in green, indicating strong performance.
Additional Features
- Toggle data points on or off as desired.
- Supports both dark and light modes.
- Position the table wherever preferred on the chart.
- Customize the ADR % calculation based on the desired number of days (default is 20 days).
Note: The calculation for the percentage away from the 52-week high is based on the closing price of the 52-week high candle, not the high price.
Notes de version
Features added:- To show P/E ratio in red if it is above 100, hinting at potential overvaluation.
- If free float market cap is less than 400 cr, it is highlighted in red, hinting at a potential
liquidity issue.
- If a share is up by more than 300% from its 52-week low, it is marked in red. This indicates
that the stock might have risen too much and may need some rest.
To summarize -
- For Market Cap - Will show in red if it is less than 1000 cr
- For free float market cap - Will show in red if it is less than 400 cr
- For the P/E ratio: It will show in red if it’s 0 (for loss-making companies) or if it’s above
100
- For ADR % - Will show in red if it is below 4 %
- For % up from 52-week low: 0 to 70 % - normal
70 to 300 % - green
Above 300 % - red
- For % down from 52w high - Will show in red if more than 20 %
Notes de version
Removed the black and white theme mode option.Now everything about table including color,opacity,text color is customizable. This is done to ensure that table does not interfere with volume bars,price bars and other data on chart.
Tip - I highly recommend to play around and adjust these basic settings according to your chart theme and liking so it merges seamlessely and does not distract and hide other vital data.
Notes de version
For market cap - M.cap above 2 lakh crore INR will be marked red. So both mcap below 1000cr and above 2,00,000 lakh crore will be red, with everything in between normalNotes de version
Changes has been made in the name of title/label in the first columm. Also some minor changes like excluding CR(crores) text from number value of market cap(value still in CR,just only not mentioned explicitly in table) and Use Indian numeric format with commas for number formatting.
Motive behind this is to reduce the size(breadth) of the table as much as possible,so it takes least possible space in chart.
Abbreviations used in first column -
Mcap - Market cap in INR crores
Free - Free float market cap in INR crores
P/E - Price/earning ratio
ADR % - Average daily range %
%52H - % away from 52week high
%52L - % up from 52week low
Notes de version
Change - % up from 52wk low - If stock is up less than 70 % from its 52week low, red color will be shown.
So for %52L : 0-70 %(slow) - red ,
70% - 300 %(optimal) - green ,
Above 300 %(overextended) - red
Now,idea behind red coloring is to make you alert of stocks potential shortcoming whether it is its liquidity,slow movement nature,valuation etc.
In my opinion,you can ignore the table altogether if nothing is red(if my parameters is acceptable to you).
But dont ignore Red data if it comes .
Tip - match the color of table background color and cell background color to your chart theme(black/white) and reduce opacity to 0 . Set text color to your liking and reduce opacity. Make visibility low so its less distracting. Red data (which is main) will pop nonetheless.
Note - Made for daily timeframe . Not to be used for any other timeframe(weeks,minutes etc ),data will be wrong
Notes de version
Now every value that defines the color of text is adjustable according to users requirement.Tailor these values according to your portfolio size,conditions and system.
You can change value of all the conditions and includes double value for each info(except Adr and % away from 52week high;because it naturally requires only one condition).
Example - If you dont prefer to trade stocks below 5000cr and also dont prefer trading stocks above 3 Lakh crore, you can change to these value in settings and text will be changed to red if it is below 5000 cr or above 3 lakh crore ( will stay normal for in between values).
Similarly, can do this P/E ratio, free float market cap, % Up from 52week low.
Notes de version
fixed some bugsScript open-source
Dans l'esprit TradingView, le créateur de ce script l'a rendu open source afin que les traders puissent examiner et vérifier ses fonctionnalités. Bravo à l'auteur! Bien que vous puissiez l'utiliser gratuitement, n'oubliez pas que la republication du code est soumise à nos Règles.
Clause de non-responsabilité
Les informations et publications ne sont pas destinées à être, et ne constituent pas, des conseils ou recommandations financiers, d'investissement, de trading ou autres fournis ou approuvés par TradingView. Pour en savoir plus, consultez les Conditions d'utilisation.
Script open-source
Dans l'esprit TradingView, le créateur de ce script l'a rendu open source afin que les traders puissent examiner et vérifier ses fonctionnalités. Bravo à l'auteur! Bien que vous puissiez l'utiliser gratuitement, n'oubliez pas que la republication du code est soumise à nos Règles.
Clause de non-responsabilité
Les informations et publications ne sont pas destinées à être, et ne constituent pas, des conseils ou recommandations financiers, d'investissement, de trading ou autres fournis ou approuvés par TradingView. Pour en savoir plus, consultez les Conditions d'utilisation.