PINE LIBRARY
Mis à jour pta_plot
Library "pta_plot"
pta_plot: This library will help you to plot different value. I will keep updating with your requirement
print_array(array_id, border_color)
Display array element as a table.
Parameters:
array_id: Id of your array.
border_color: Color for border (`color.black` is used if no argument is supplied).
Returns: Display array element in bottom of the pane.
Notes de version
v2Added:
print_array_float(array_id, border_color)
Display array element as a table.
Parameters:
array_id: Id of your array.
border_color: Color for border (`color.black` is used if no argument is supplied).
Returns: Display array element in bottom of the pane.
print_array_int(array_id, border_color)
Display array element as a table.
Parameters:
array_id: Id of your array.
border_color: Color for border (`color.black` is used if no argument is supplied).
Returns: Display array element in bottom of the pane.
Removed:
print_array(array_id, border_color)
Display array element as a table.
Notes de version
v3Added:
print_array_string(array_id, border_color)
Display array element as a table.
Parameters:
array_id: Id of your array.
border_color: Color for border (`color.black` is used if no argument is supplied).
Returns: Display array element in bottom of the pane.
Notes de version
v4Notes de version
v5Added:
print_array_bool(array_id, border_color)
Display array element as a table.
Parameters:
array_id: Id of your array.
border_color: Color for border (`color.black` is used if no argument is supplied).
Returns: Display array element in bottom of the pane.
Notes de version
v6Added:
peakprofit(longcondition, shortcondition)
peakprofit: This function will create a label for max profit in trade range.
Parameters:
longcondition: is a Boolean Value
shortcondition: is a Boolean Value
Returns: peakprofit Create Label on Chart
Instruction: Don't forget to add max_labels_count=500, max_bars_back=500
Notes de version
v7Updated:
print_array_float(array_id, position, border_color)
Display array element as a table.
Parameters:
array_id: Id of your array.
position
border_color: Color for border (`color.black` is used if no argument is supplied).
Returns: Display array element in bottom of the pane.
print_array_int(array_id, position, border_color)
Display array element as a table.
Parameters:
array_id: Id of your array.
position: Position of Table
border_color: Color for border (`color.black` is used if no argument is supplied).
Returns: Display array element in bottom of the pane.
print_array_string(array_id, position, border_color)
Display array element as a table.
Parameters:
array_id: Id of your array.
position: Position of Table
border_color: Color for border (`color.black` is used if no argument is supplied).
Returns: Display array element in bottom of the pane.
print_array_bool(array_id, position, border_color)
Display array element as a table.
Parameters:
array_id: Id of your array.
position: Position of Table
border_color: Color for border (`color.black` is used if no argument is supplied).
Returns: Display array element in bottom of the pane.
Removed:
peakprofit(longcondition, shortcondition)
peakprofit: This function will create a label for max profit in trade range.
Notes de version
v8Added:
calcCPR(High, Low, Close)
Return CPR.
Parameters:
High (float)
Low (float)
Close (float)
Returns: CPR Value as Tuple [pp, tc, bc, r1, r2, r3, r4, s1, s2, s3, s4].
Notes de version
Version 9 Updates:- `dll` function:
- Function's purpose : Plot a horizontal line and label at a specified price level on the chart.
- Parameters:
- Price (float): The Y value for the line and label.
- Text (string): The text to display alongside the label.
- Color (color): The color for the line and label text.
- Width (int, default=1): The width of the line.
- LineStyle (string, default=line.style_solid): The style of the line.
- Historical (bool, default=false): If true, the line and label will appear on historical chart data.
- Returns: Displays a horizontal line and label on the chart.
- Motive: Enhances readability and usability by providing a function for plotting customizable lines and labels on charts.
Notes de version
v10- `dll` function updated:
- Function's purpose : Plot a horizontal line and label at a specified price level on the chart.
- Parameters:
- Price (float): The Y value for the line and label.
- Text (string): The text to display alongside the label.
- Color (color): The color for the line and label text.
- Width (int, default=1): The width of the line.
- LineStyle (string, default=line.style_solid): The style of the line.
- Historical (bool, default=false): If true, the line and label will appear on historical chart data.
- Returns: Displays a horizontal line and label on the chart.
- Motive: Enhances readability and usability by providing a function for plotting customizable lines and labels on charts.
Notes de version
v11Updated:
dll(Price, Text, barCount, Color, Width, LineStyle, Historical)
Parameters:
Price (float)
Text (string)
barCount (int)
Color (color)
Width (int)
LineStyle (string)
Historical (bool)
Notes de version
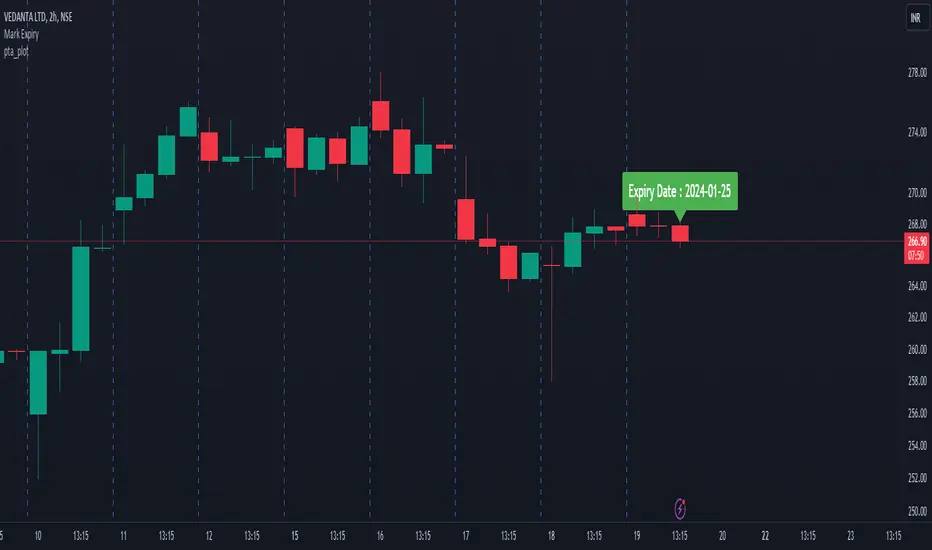
v12Added:
getExpiry(expiryType, expiryDay, changeExpiry, format)
Parameters:
expiryType (string)
expiryDay (string)
changeExpiry (int)
format (string)
Bibliothèque Pine
Dans l'esprit TradingView, l'auteur a publié ce code Pine sous forme de bibliothèque open source afin que d'autres programmeurs Pine de notre communauté puissent le réutiliser. Bravo à l'auteur! Vous pouvez utiliser cette bibliothèque à titre privé ou dans d'autres publications open source, mais la réutilisation de ce code dans des publications est régie par nos Règles.
Clause de non-responsabilité
Les informations et publications ne sont pas destinées à être, et ne constituent pas, des conseils ou recommandations financiers, d'investissement, de trading ou autres fournis ou approuvés par TradingView. Pour en savoir plus, consultez les Conditions d'utilisation.