PROTECTED SOURCE SCRIPT
Mis à jour Ultimate RSI

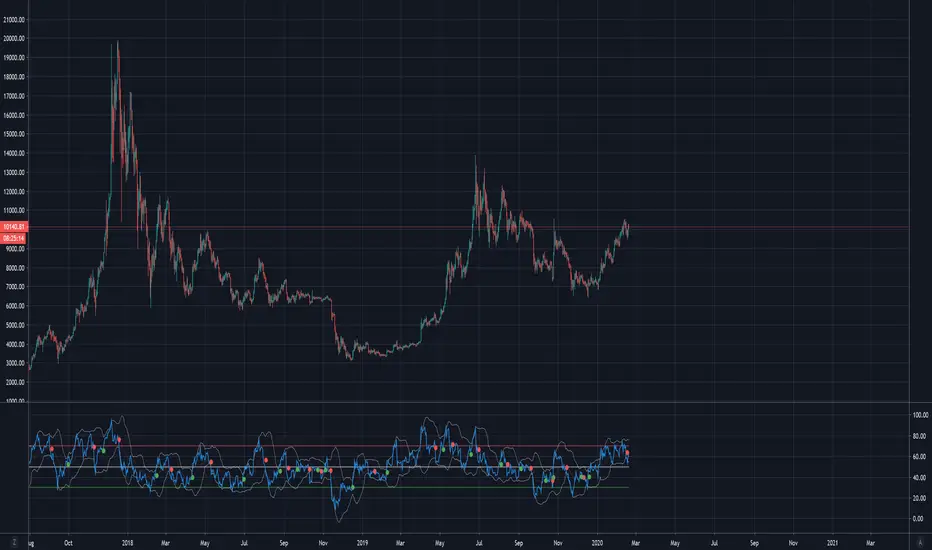
RSI w/BBands and 12 period moving average.
BBands show the standard deviation of the RSI, and can therefore suggest if a trend is oversold or overbought in conjunction with the 30 and 70 RSI values. A tightening of the BBands also suggests a major move/trend change is immanent.
The RSI moving average can suggest if the RSI is in a bullish or bearish trend . So if RSI>RSIMA then bullish trend , and if RSI<RSIMA then bearish trend . The RSIMA can also be used as another way to determine the true RSI values by eliminating noise and big sudden price movements (e.g. liquidation wicks). So for example if the RSIMA is at 70, then we know the asset is oversold etc
Notes de version
Ultimate RSI w/BB+EMA'sScript protégé
Ce script est publié en source fermée. Cependant, vous pouvez l'utiliser librement et sans aucune restriction – pour en savoir plus, cliquez ici.
Clause de non-responsabilité
Les informations et publications ne sont pas destinées à être, et ne constituent pas, des conseils ou recommandations financiers, d'investissement, de trading ou autres fournis ou approuvés par TradingView. Pour en savoir plus, consultez les Conditions d'utilisation.
Script protégé
Ce script est publié en source fermée. Cependant, vous pouvez l'utiliser librement et sans aucune restriction – pour en savoir plus, cliquez ici.
Clause de non-responsabilité
Les informations et publications ne sont pas destinées à être, et ne constituent pas, des conseils ou recommandations financiers, d'investissement, de trading ou autres fournis ou approuvés par TradingView. Pour en savoir plus, consultez les Conditions d'utilisation.