PROTECTED SOURCE SCRIPT
Mis à jour Dynamical Support and Resistance [Fournier-Eaton]

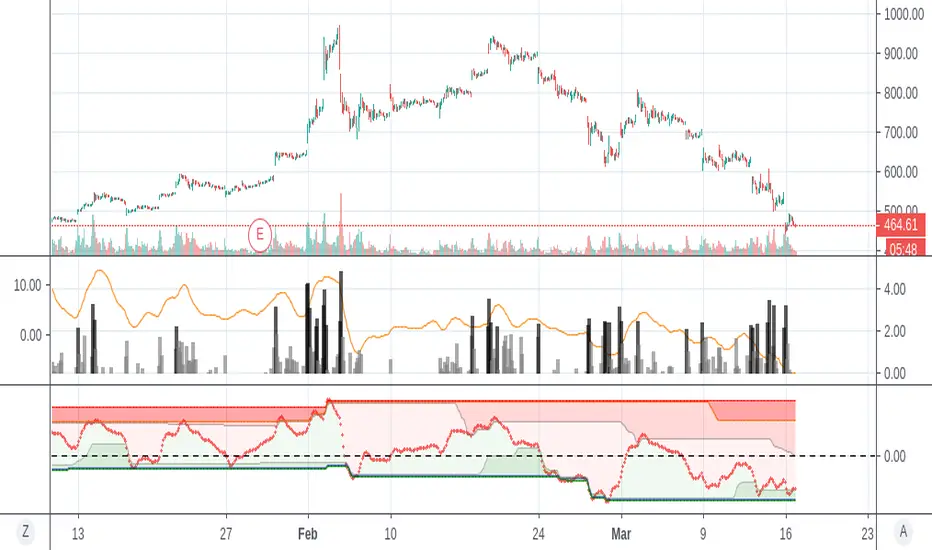
The Dynamical Support and Resistance Indicator finds support and resistance levels.
The plot is price relative: if the indicator nears one of its supports or resistances then the price is likewise nearing a support.
The levels are dynamical: once a support or resistance is broken, a new calculation is performed.
There are 3 supports and 3 resistances each with a longer time-frame. Breaking through the first shouldn't signal much, breaking through the third is programmed to only happen at a significant number of standard deviations.
Enjoy. Feedback appreciated
Notes de version
- Clearer Upper and lower levels
- Enhanced performance in higher volatility
- More responsive tight-bound levels.
Notes de version
- Clearer zones by coloring- Better self-adjusting look-back.
Script protégé
Ce script est publié en source fermée. Cependant, vous pouvez l'utiliser librement et sans aucune restriction – pour en savoir plus, cliquez ici.
Clause de non-responsabilité
Les informations et publications ne sont pas destinées à être, et ne constituent pas, des conseils ou recommandations financiers, d'investissement, de trading ou autres fournis ou approuvés par TradingView. Pour en savoir plus, consultez les Conditions d'utilisation.