OPEN-SOURCE SCRIPT
Custom Group Financials [Technimentals]
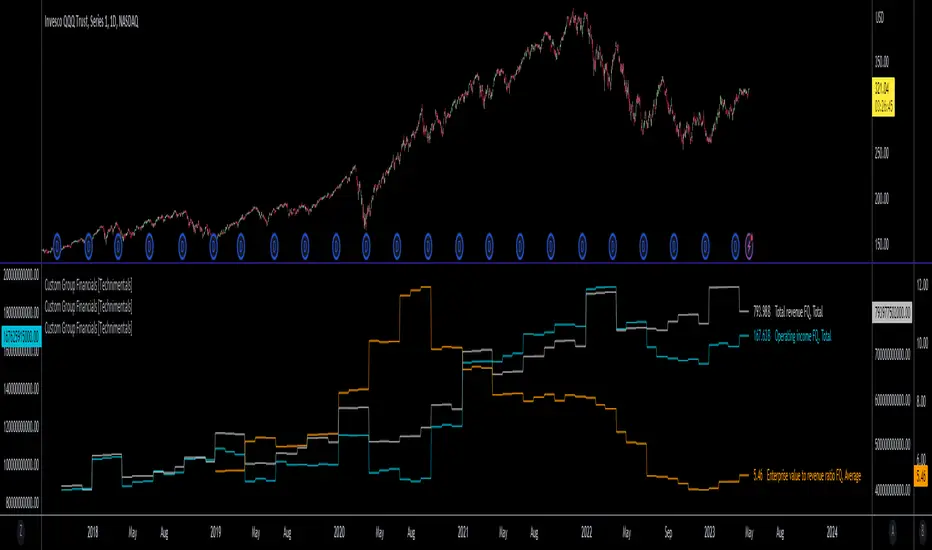
This script allows the user to build custom groups and combine the same financial data from 40 different symbols simultaneously and plot it data as a total or as an average.
By default, the top 40 symbols in the QQQ are used. Between them they account for the majority of the index. This is a good workaround for the lack of ETF financial data in TradingView.
This functions much like any other financial indicator. You choose the financial data and period:
FY = Financial Year
FQ = Financial Quarter
TTM = Trailing Twelve Months
Bare in mind that some data only exists in FY data.
Thanks to LucF for writing most of this code!
Enjoy!
Script open-source
Dans l'esprit TradingView, le créateur de ce script l'a rendu open source afin que les traders puissent examiner et vérifier ses fonctionnalités. Bravo à l'auteur! Bien que vous puissiez l'utiliser gratuitement, n'oubliez pas que la republication du code est soumise à nos Règles.
Clause de non-responsabilité
Les informations et publications ne sont pas destinées à être, et ne constituent pas, des conseils ou recommandations financiers, d'investissement, de trading ou autres fournis ou approuvés par TradingView. Pour en savoir plus, consultez les Conditions d'utilisation.