PROTECTED SOURCE SCRIPT
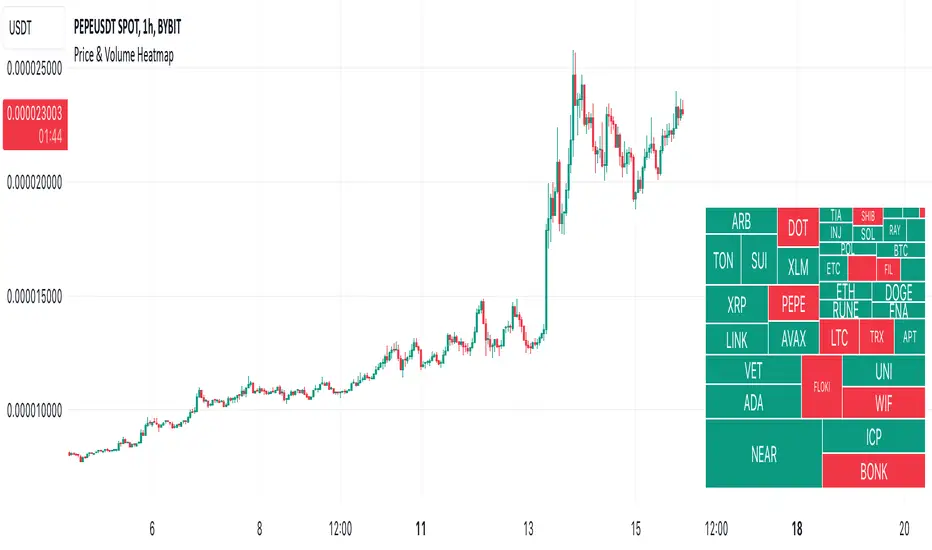
Price & Volume Heatmap

Description:
Displays a heatmap (like TV's Stock Heatmap) for up to 40 symbols (either from 3 presets, or custom). It can show Price Change, Volume Change and Volume (in $). The text size for each symbol can auto-change based on whether it fits into the cell. Each cell shows the name of the symbol, and when hovered - it shows the value.
Inputs:
- Symbols -> which symbols to use (Custom, or predefined list of Stocks/Crypto/Forex)
- Data -> show Price Change (%), Volume Change (%) or Volume ($)
- Custom -> put your custom list of symbols here (comma separated without spaces, up to 40 symbols)
- Position -> heatmap position
- Height / Width -> height / width of the heatmap (% of indicator's space)
- Text Size -> can be constant (Tiny/Normal/etc) or automatically change based on the text of each cell (Auto/Auto (Smaller))
- Color -> text color
Notes:
It is not recommended to use the script on timeframes below 30 seconds, because it may be too slow there (since it's based on a table object, it might be slow).
Script protégé
Ce script est publié en source fermée. Cependant, vous pouvez l'utiliser librement et sans aucune restriction – pour en savoir plus, cliquez ici.
Clause de non-responsabilité
Les informations et publications ne sont pas destinées à être, et ne constituent pas, des conseils ou recommandations financiers, d'investissement, de trading ou autres fournis ou approuvés par TradingView. Pour en savoir plus, consultez les Conditions d'utilisation.