PROTECTED SOURCE SCRIPT
Mis à jour Macro Paradox
Macro Paradox: A Detailed Explanation
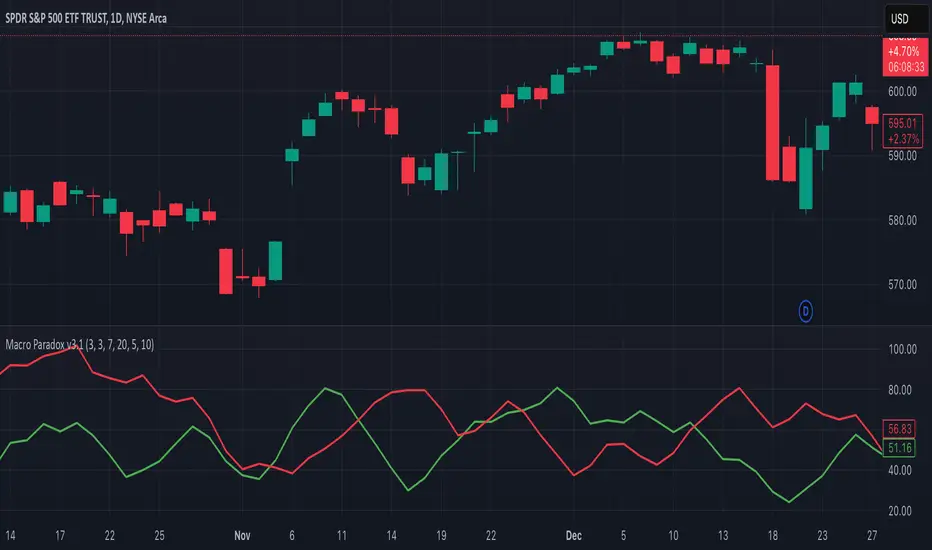
This indicator utilizes multiple streams of global liquidity data (from the US, China, Japan, the UK, and the Eurozone) and combines them with the DXY and HYG for a “macro plumbing” insight. Surprisingly, this creates a paradoxical predictive relationship: when the green line (Weighted DXY) begins rising, dollar-denominated equities (e.g., SPY) often show bullish momentum about 4–7 days later, and vice versa. Below is an in-depth explanation of why and how this occurs.
A rising Weighted DXY line (green) often foretells—4 to 7 days later—an upswing in US equities, contrary to the typical notion that a stronger dollar always harms risk assets. By blending net global liquidity, HYG’s risk appetite measure, and a weighting factor keyed to the chart’s trend, this indicator provides a novel, smoother view of macro flows.
Note: For best results, use Daily or higher timeframes to align with the release schedule of the underlying liquidity data. This avoids short-term noise that doesn’t reflect actual macro changes.
This indicator utilizes multiple streams of global liquidity data (from the US, China, Japan, the UK, and the Eurozone) and combines them with the DXY and HYG for a “macro plumbing” insight. Surprisingly, this creates a paradoxical predictive relationship: when the green line (Weighted DXY) begins rising, dollar-denominated equities (e.g., SPY) often show bullish momentum about 4–7 days later, and vice versa. Below is an in-depth explanation of why and how this occurs.
- Global Liquidity Calculation
The script aggregates the balance sheets or liquidity proxies of major central banks and bond markets, including:
Bank of Japan (multiplied by JPYUSD)
People’s Bank of China (multiplied by CNYUSD)
Bank of England (multiplied by GBPUSD)
US Federal Reserve (WALCL)
European Central Bank (multiplied by EURUSD)
Subtracts reverse repo (RRP) and US Treasury general account (TGA) balances (treas_genac)
This net figure represents the total “flow” of major currency liquidity. Higher net liquidity often indicates rising risk-on appetite; lower liquidity can imply risk-off conditions. - HYG Inclusion for Risk Appetite
HYG (the high-yield corporate bond ETF) is a strong barometer of market risk tolerance. When HYG is robust, it indicates investors are willing to buy higher-yield, lower-rated corporate bonds—implying confidence in economic expansion. The script scales HYG like total liquidity, then applies a user-defined weighting (hygWeight) so its movement influences the final combined line. - Scaling and Double-EMA Smoothing
For both liquidity (total) and each risk metric (DXY, HYG), the script:
Normalizes them over a lookback window (lookbackBars) to a 0–100 scale, aligning different absolute values onto a comparable range.
Applies two EMAs in sequence (smoothLengthFast, smoothLengthSlow)—similar to a MACD-style smoothing—to remove noise and reveal underlying trend momentum more clearly.
By smoothing twice, you get a cleaner signal, making it easier to spot turning points without the usual whipsaws seen with single-smoothing. - Weighted by the Chart’s Price Action
To reflect how these macro flows interact with the specific ticker, the script compares close price to its EMA (myTickerEma). The ratio (close / myTickerEma) is raised to weightPower, amplifying how overextended or under-extended the ticker is relative to its own trend. The final scaled lines are multiplied by this “weightFactor,” adapting them to each ticker’s current price trend. - “Paradoxical” DXY Relationship Explained
Conventionally, a strengthening US dollar can pressure risk assets. However, this script shows a rising Weighted DXY line (green) is often followed by bullishness in dollar-based equities (e.g., SPY) several days later. Why?
When global liquidity is high, capital can flow into US assets, supporting both the dollar and equities.
HYG being strong signals credit-fueled demand; combined with global liquidity, this can push bond and equity prices higher simultaneously.
As the DXY “catches a bid,” it hints at global investors allocating to US assets. This often takes 4–7 days to reflect in the broader equity market, giving the illusion of a “paradox.” - Practical Usage and Timeframes
Because major liquidity data (from central banks, RRP, TGA, etc.) is updated once a day or weekly, smaller intraday charts (like 1-hour) will not accurately capture these macro flows. For this reason, the indicator is most reliable on Daily charts. At higher frequency, signals can be misleading because the macro data does not refresh that often. - Why It’s Unique
- Combines total global net liquidity and credit risk sentiment (HYG) into one line, then cross-compares it to DXY for insight into capital flows.
- Applies a two-stage EMA smoothing for each series, reducing noise and clarifying the macro trend signal.
- Weights the signal by the chart’s own price trend, adapting to each ticker’s technical conditions.
- Reveals an unusual yet historically consistent “delayed bullishness” effect when the Weighted DXY (green) starts climbing.
- Combines total global net liquidity and credit risk sentiment (HYG) into one line, then cross-compares it to DXY for insight into capital flows.
A rising Weighted DXY line (green) often foretells—4 to 7 days later—an upswing in US equities, contrary to the typical notion that a stronger dollar always harms risk assets. By blending net global liquidity, HYG’s risk appetite measure, and a weighting factor keyed to the chart’s trend, this indicator provides a novel, smoother view of macro flows.
Note: For best results, use Daily or higher timeframes to align with the release schedule of the underlying liquidity data. This avoids short-term noise that doesn’t reflect actual macro changes.
Notes de version
Chart update.Notes de version
Updated the indicator with the following:- improved the algorithm for higher accuracy
- made the lines more distinct so that they are easier to read and comprehend
- tweaked the EMA lengths
Notes de version
Fixing a small typo in codeScript protégé
Ce script est publié en source fermée. Cependant, vous pouvez l'utiliser librement et sans aucune restriction – pour en savoir plus, cliquez ici.
Clause de non-responsabilité
Les informations et publications ne sont pas destinées à être, et ne constituent pas, des conseils ou recommandations financiers, d'investissement, de trading ou autres fournis ou approuvés par TradingView. Pour en savoir plus, consultez les Conditions d'utilisation.
Script protégé
Ce script est publié en source fermée. Cependant, vous pouvez l'utiliser librement et sans aucune restriction – pour en savoir plus, cliquez ici.
Clause de non-responsabilité
Les informations et publications ne sont pas destinées à être, et ne constituent pas, des conseils ou recommandations financiers, d'investissement, de trading ou autres fournis ou approuvés par TradingView. Pour en savoir plus, consultez les Conditions d'utilisation.