OPEN-SOURCE SCRIPT
Mis à jour Moving Average Percentage Difference

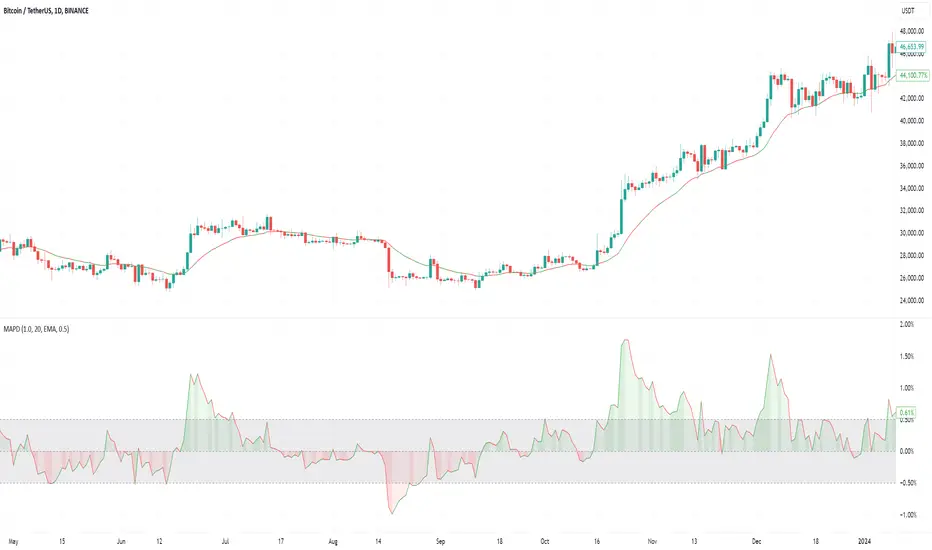
Moving average is a great tool to identify the asset direction. However, it's hard to see whether the moving average speeds up or slows down from just looking at it. Ideally we want it to go faster as it will show a strong trend. And if it slows down - then the trend becomes weaker. This indicator helps to identify it. Theoretically, it could be shown with an angle of the moving average, but I don't like this idea as the angle depends on the scale: you zoom in and it looks very steep, you zoom out - and it's all flat. But the percentage change is always the percentage, no matter what zoom you use.
It also allows you to set a twilight zone to filter periods when MA does nothing.
Think about this indicator from this perspective: if a normal moving average shows the speed of a trend, then this indicator shows the change of the speed or in other words - acceleration.
It also allows you to set a twilight zone to filter periods when MA does nothing.
Think about this indicator from this perspective: if a normal moving average shows the speed of a trend, then this indicator shows the change of the speed or in other words - acceleration.
Notes de version
V1.1:- Updated PineScript to V6
- Updated the description (see below)
What does this indicator do (for regular users)?
It calculates the percentage change of a moving average compared to its value one candle ago. You can choose from seven types of moving averages.
What does this indicator do (for technical users)?
It computes the rate of change (ROC) with a period of 2 for SMA, EMA, VWMA, RMA, WMA, HMA, or SWMA.
Why is this important?
Traders often use the point when a moving average changes direction as a signal for entry or exit. This indicator helps anticipate such changes. Before a moving average changes direction, it must first slow down. The indicator reveals whether the moving average is slowing down or speeding up.
Think of it like this: before a car moves backward, it must slow down, stop, and then reverse. Moving averages behave similarly. Instead of guessing whether your moving average is slowing down or speeding up just by observing it, you can use this indicator to get a precise numeric value.
Additional feature:
You can define a "twilight zone" to highlight areas where the moving average experiences whipsawing. This is useful for trend followers to avoid flat periods or for mean-reversion strategies to identify favorable conditions.
Script open-source
Dans l'esprit TradingView, le créateur de ce script l'a rendu open source afin que les traders puissent examiner et vérifier ses fonctionnalités. Bravo à l'auteur! Bien que vous puissiez l'utiliser gratuitement, n'oubliez pas que la republication du code est soumise à nos Règles.
Clause de non-responsabilité
Les informations et publications ne sont pas destinées à être, et ne constituent pas, des conseils ou recommandations financiers, d'investissement, de trading ou autres fournis ou approuvés par TradingView. Pour en savoir plus, consultez les Conditions d'utilisation.