OPEN-SOURCE SCRIPT
Custom Hourly Highlight Periods

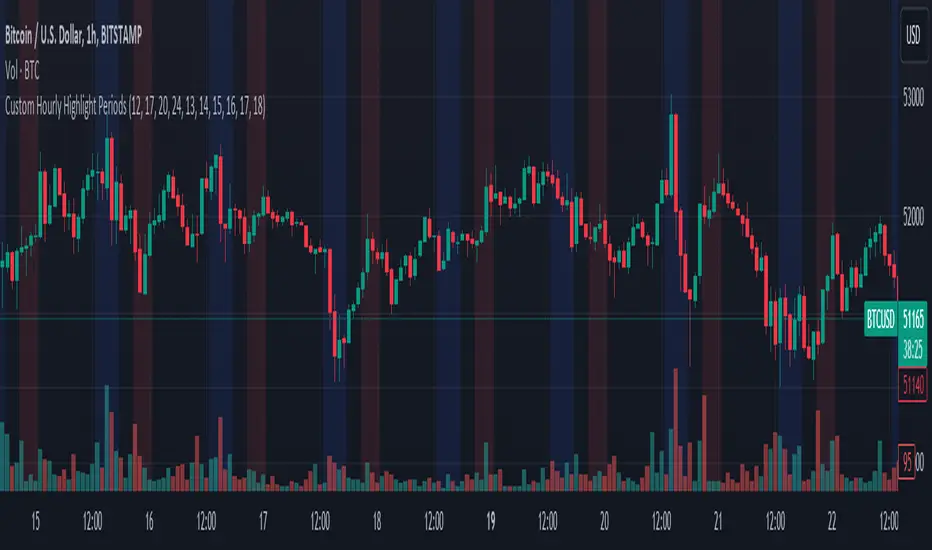
This Pine Script indicator for TradingView allows users to visually highlight up to five distinct periods within a trading day directly on their chart. It's designed to enhance chart analysis by emphasizing specific time frames that may coincide with increased market activity, trading sessions, or personal trading strategies.
Features:
Use Cases:
Features:
- Customizable Highlight Periods: Users can define up to five separate highlight periods, specifying both start and end hours for each. This flexibility supports a wide range of trading strategies and time zones.
- Individual Period Activation: Each highlight period can be individually enabled or disabled, allowing users to focus on specific times of interest without cluttering the chart.
- Color-Coded Visualization: Each period is highlighted with a different transparent color (blue, red, green, purple, and orange) for clear distinction between different segments of the trading day. Colors are customizable to fit personal preferences or chart themes.
- User-Friendly Inputs: Simple input fields make it easy to adjust start/end times and toggle the visibility of each period, requiring no coding experience to customize.
Use Cases:
- Identifying Repeating Patterns: Certain regional markets exhibit unique behaviors, with some creating sell pressure in the morning, while others generate buy pressure. This indicator allows for clear visualization of these patterns.
- Market Session Highlights: Emphasize the opening and closing hours of major markets (e.g., NYSE, NASDAQ, Forex markets) to identify potential volatility or trading opportunities.
- Personal Trading Hours: Mark the time frames when you typically trade or when your trading strategy performs best.
- Economic Release Times: Highlight periods when important economic reports are released, which can significantly impact market movement.
Script open-source
Dans l'esprit TradingView, le créateur de ce script l'a rendu open source afin que les traders puissent examiner et vérifier ses fonctionnalités. Bravo à l'auteur! Bien que vous puissiez l'utiliser gratuitement, n'oubliez pas que la republication du code est soumise à nos Règles.
Clause de non-responsabilité
Les informations et publications ne sont pas destinées à être, et ne constituent pas, des conseils ou recommandations financiers, d'investissement, de trading ou autres fournis ou approuvés par TradingView. Pour en savoir plus, consultez les Conditions d'utilisation.