PROTECTED SOURCE SCRIPT
Mis à jour RSI_Board_Warning
Indicator Description
Name: Multi-TimeFrame RSI Board with Warnings & Alerts
Purpose:
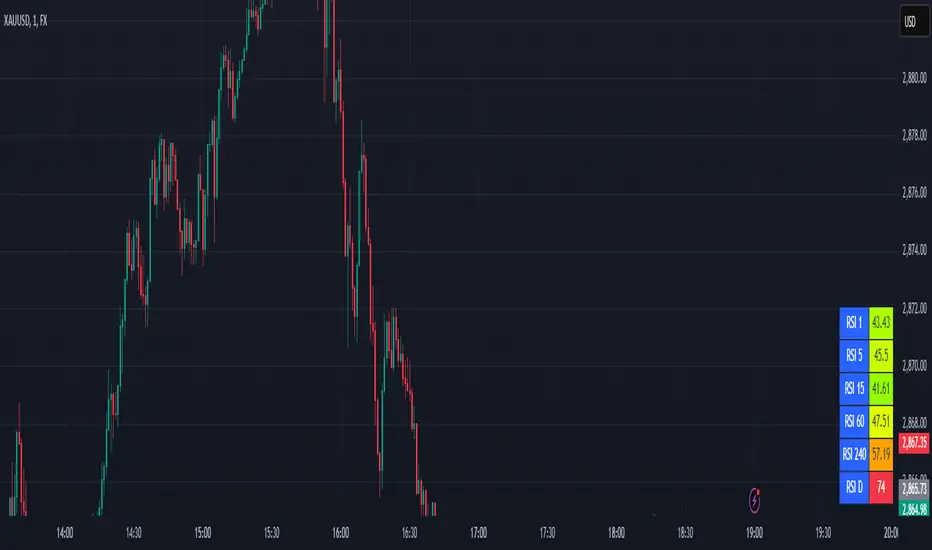
This indicator calculates and displays the Relative Strength Index (RSI) values for six user-selectable timeframes in a fixed-position table on your chart. It not only shows the current RSI values with dynamic background and text coloring (to reflect overbought and oversold conditions) but also monitors four configurable pairs of timeframes. If both timeframes in a pair are simultaneously oversold or overbought, the indicator triggers an alert condition.
Key Features:
Multi-TimeFrame RSI Calculation:
The indicator uses a single user-defined RSI period (default is 14) to calculate the RSI values.
Six different timeframes (e.g., "1", "5", "15", "60", "240", "D") are available as inputs.
These values are computed using the request.security function and updated in real time.
Fixed RSI Board (Table):
A table is displayed on your chart, fixed to one of the viewport corners (Top Left, Top Right, Bottom Left, or Bottom Right) based on your selection.
The table has a header row that dynamically labels each column with the respective timeframe (e.g., "RSI 1", "RSI 5", etc.).
The data row shows the RSI values for each timeframe, formatted to two decimal places.
Dynamic Cell Coloring and Readable Text:
Each RSI cell’s background color is determined by its value relative to user-defined overbought and oversold thresholds (defaults are 70 and 30, respectively):
Below the oversold threshold: The cell background is green.
Above the overbought threshold: The cell background is red.
Intermediate values: The background color interpolates from green to yellow (if the value is between oversold and 50) and from yellow to red (if the value is between 50 and overbought).
A helper function sets the text color (black or white) dynamically for optimum readability against the colored background.
Warning Pairs and Alert Conditions:
Four warning pairs are defined, each comparing two different timeframes. The default pairs are:
Pair 1: M1 with M5 (e.g., "1" and "5")
Pair 2: M5 with M15 (e.g., "5" and "15")
Pair 3: M30 with H1 (e.g., "30" and "60")
Pair 4: H1 with H4 (e.g., "60" and "240")
For each pair, the indicator calculates RSI values on the two selected timeframes.
An alert condition is triggered if both RSI values in a pair are simultaneously:
Oversold: (i.e., both are below the oversold threshold)
Overbought: (i.e., both are above the overbought threshold)
Since Pine Script requires alert messages to be constant strings, the alert messages are fixed (for example, "Pair 1 oversold: both RSIs are below threshold.").
User Manual
Installation and Setup:
Adding the Indicator:
Open TradingView and navigate to the Pine Script Editor.
Create a new indicator script, paste the complete code provided, and save it.
Add the indicator to your chart.
Configuring the RSI Calculation:
RSI Period: Set the RSI period (default is 14). This period is applied to all timeframe calculations.
Timeframe Inputs for the Board: Enter the six timeframes you want to monitor (for example, "1", "5", "15", "60", "240", "D"). These should be entered as strings.
Setting Thresholds:
Overbought Threshold: Default is 70.
Oversold Threshold: Default is 30.
These thresholds determine the dynamic cell background colors and the alert conditions.
Positioning the RSI Board:
Choose the desired position for the table using the dropdown (e.g., "Top Left"). The table will appear in that fixed corner of your viewport.
Configuring Warning Pairs:
Four warning pairs are provided by default. For each pair, you can choose two timeframes:
Pair 1: Example defaults are "1" and "5".
Pair 2: Example defaults are "5" and "15".
Pair 3: Example defaults are "30" and "60".
Pair 4: Example defaults are "60" and "240".
You can change these values to any valid timeframe strings as desired.
Using the Indicator:
Monitoring the RSI Board:
Once added to your chart, the table will display the RSI values for the six timeframes you configured.
The header row shows labels like "RSI 1", "RSI 5", etc.
The data row displays the RSI values. Each cell’s background color changes dynamically:
Green when the RSI is low (oversold).
Red when the RSI is high (overbought).
A gradient color for intermediate values.
The text color adjusts automatically for readability.
Understanding the Warning Pairs:
The indicator continuously monitors the four warning pairs.
If both RSI values in a pair are simultaneously below the oversold threshold, the indicator triggers an oversold alert for that pair.
If both RSI values in a pair are simultaneously above the overbought threshold, an overbought alert is triggered for that pair.
Setting Up Alerts in TradingView:
Open the TradingView alert dialog.
Select the indicator’s alert conditions (e.g., "Warning Pair 1 Oversold", "Warning Pair 1 Overbought", etc.).
Configure your alert notification settings (sound, email, SMS, etc.).
These alerts will notify you whenever the specified warning conditions are met.
Customization:
Adjust the RSI period, thresholds, timeframes, and warning pair timeframes as needed via the input options.
The alert messages are fixed, but you can modify the code if you wish to change the wording (keeping in mind they must remain constant strings).
Additional Tips:
Testing:
Before relying on the alerts in live trading, test the indicator on historical data to ensure that the warning conditions and dynamic color changes behave as expected.
Further Customizations:
You might consider adding features such as:
Additional rows or columns in the table for other indicators.
More refined gradient or text color functions based on your visual preference.
Extra alert conditions (such as RSI delta changes) if desired.
Name: Multi-TimeFrame RSI Board with Warnings & Alerts
Purpose:
This indicator calculates and displays the Relative Strength Index (RSI) values for six user-selectable timeframes in a fixed-position table on your chart. It not only shows the current RSI values with dynamic background and text coloring (to reflect overbought and oversold conditions) but also monitors four configurable pairs of timeframes. If both timeframes in a pair are simultaneously oversold or overbought, the indicator triggers an alert condition.
Key Features:
Multi-TimeFrame RSI Calculation:
The indicator uses a single user-defined RSI period (default is 14) to calculate the RSI values.
Six different timeframes (e.g., "1", "5", "15", "60", "240", "D") are available as inputs.
These values are computed using the request.security function and updated in real time.
Fixed RSI Board (Table):
A table is displayed on your chart, fixed to one of the viewport corners (Top Left, Top Right, Bottom Left, or Bottom Right) based on your selection.
The table has a header row that dynamically labels each column with the respective timeframe (e.g., "RSI 1", "RSI 5", etc.).
The data row shows the RSI values for each timeframe, formatted to two decimal places.
Dynamic Cell Coloring and Readable Text:
Each RSI cell’s background color is determined by its value relative to user-defined overbought and oversold thresholds (defaults are 70 and 30, respectively):
Below the oversold threshold: The cell background is green.
Above the overbought threshold: The cell background is red.
Intermediate values: The background color interpolates from green to yellow (if the value is between oversold and 50) and from yellow to red (if the value is between 50 and overbought).
A helper function sets the text color (black or white) dynamically for optimum readability against the colored background.
Warning Pairs and Alert Conditions:
Four warning pairs are defined, each comparing two different timeframes. The default pairs are:
Pair 1: M1 with M5 (e.g., "1" and "5")
Pair 2: M5 with M15 (e.g., "5" and "15")
Pair 3: M30 with H1 (e.g., "30" and "60")
Pair 4: H1 with H4 (e.g., "60" and "240")
For each pair, the indicator calculates RSI values on the two selected timeframes.
An alert condition is triggered if both RSI values in a pair are simultaneously:
Oversold: (i.e., both are below the oversold threshold)
Overbought: (i.e., both are above the overbought threshold)
Since Pine Script requires alert messages to be constant strings, the alert messages are fixed (for example, "Pair 1 oversold: both RSIs are below threshold.").
User Manual
Installation and Setup:
Adding the Indicator:
Open TradingView and navigate to the Pine Script Editor.
Create a new indicator script, paste the complete code provided, and save it.
Add the indicator to your chart.
Configuring the RSI Calculation:
RSI Period: Set the RSI period (default is 14). This period is applied to all timeframe calculations.
Timeframe Inputs for the Board: Enter the six timeframes you want to monitor (for example, "1", "5", "15", "60", "240", "D"). These should be entered as strings.
Setting Thresholds:
Overbought Threshold: Default is 70.
Oversold Threshold: Default is 30.
These thresholds determine the dynamic cell background colors and the alert conditions.
Positioning the RSI Board:
Choose the desired position for the table using the dropdown (e.g., "Top Left"). The table will appear in that fixed corner of your viewport.
Configuring Warning Pairs:
Four warning pairs are provided by default. For each pair, you can choose two timeframes:
Pair 1: Example defaults are "1" and "5".
Pair 2: Example defaults are "5" and "15".
Pair 3: Example defaults are "30" and "60".
Pair 4: Example defaults are "60" and "240".
You can change these values to any valid timeframe strings as desired.
Using the Indicator:
Monitoring the RSI Board:
Once added to your chart, the table will display the RSI values for the six timeframes you configured.
The header row shows labels like "RSI 1", "RSI 5", etc.
The data row displays the RSI values. Each cell’s background color changes dynamically:
Green when the RSI is low (oversold).
Red when the RSI is high (overbought).
A gradient color for intermediate values.
The text color adjusts automatically for readability.
Understanding the Warning Pairs:
The indicator continuously monitors the four warning pairs.
If both RSI values in a pair are simultaneously below the oversold threshold, the indicator triggers an oversold alert for that pair.
If both RSI values in a pair are simultaneously above the overbought threshold, an overbought alert is triggered for that pair.
Setting Up Alerts in TradingView:
Open the TradingView alert dialog.
Select the indicator’s alert conditions (e.g., "Warning Pair 1 Oversold", "Warning Pair 1 Overbought", etc.).
Configure your alert notification settings (sound, email, SMS, etc.).
These alerts will notify you whenever the specified warning conditions are met.
Customization:
Adjust the RSI period, thresholds, timeframes, and warning pair timeframes as needed via the input options.
The alert messages are fixed, but you can modify the code if you wish to change the wording (keeping in mind they must remain constant strings).
Additional Tips:
Testing:
Before relying on the alerts in live trading, test the indicator on historical data to ensure that the warning conditions and dynamic color changes behave as expected.
Further Customizations:
You might consider adding features such as:
Additional rows or columns in the table for other indicators.
More refined gradient or text color functions based on your visual preference.
Extra alert conditions (such as RSI delta changes) if desired.
Notes de version
Small Color Fix on RSI BoardNotes de version
Small Bug FixNotes de version
.Notes de version
SummaryThe RSI_MultiTimeFrame indicator is a multi-timeframe RSI tool that not only displays RSI values from several timeframes in an on‐chart table (with dynamic coloring) but also provides potential trade signals via tiny arrow markers. The indicator is built around customizable “warning pairs.” Each warning pair consists of two user‑selected timeframes used to compute separate RSI values. When both RSI values of a pair are either oversold or overbought—and if the chart’s current timeframe matches the user‑selected “active” timeframe for that pair—a trade signal is triggered. A Buy signal (when oversold) plots a tiny upward arrow below the bar, and a Sell signal (when overbought) plots a tiny downward arrow above the bar. Importantly, the arrow is only shown on the closed candle at the moment the condition transitions from false to true.
Features
Multiple RSI Calculations:
Calculate the RSI on up to six different timeframes for board display.
Dynamic RSI Table:
A table is drawn on the chart that shows the RSI values (with colors dynamically reflecting oversold/overbought regions).
Customizable Warning Pairs:
Define up to five warning pairs. For each pair, you can choose:
Two timeframes (used to calculate separate RSI values).
A chart timeframe on which this pair is active (i.e. the indicator will only look for signals from that pair when your chart’s timeframe matches this input).
Signal Arrows:
Buy Signal: When both RSI values for an active warning pair drop below the oversold threshold, a tiny upward (buy) arrow is plotted below the candle.
Sell Signal: When both RSI values exceed the overbought threshold, a tiny downward (sell) arrow is plotted above the candle.
The arrows are plotted only once—on the bar where the condition first occurs (using a transition check).
Alert Conditions:
Built-in alert conditions are available so you can set up TradingView alerts based on the oversold or overbought conditions for each warning pair.
Inputs Overview
RSI Settings:
RSI Period: The number of bars used for the RSI calculation (default is 14).
RSI Thresholds:
Overbought Threshold (default 70)
Oversold Threshold (default 30)
Board Display Settings:
Timeframe 1 to 6: These inputs (e.g., "1", "5", "15", "60", "240", "D") determine the various timeframes whose RSI values will be displayed in the on‑chart table.
RSI Board Position: Choose which corner of the chart the table appears (e.g., Top Left, Top Right, etc.).
Warning Pair Settings (for each pair 1–5):
Two RSI Timeframes:
Specify the two different timeframes used to calculate the RSI values for the pair.
Active Chart Timeframe:
Choose the chart timeframe (from options like "1", "5", "15", "30", "60", or "D") on which this warning pair should be monitored for signals.
How It Works
RSI Calculations:
The indicator uses TradingView’s request.security function to calculate the RSI for each timeframe used in the board and for each warning pair.
Warning Pair Conditions:
For each warning pair, two conditions are evaluated:
Oversold Condition (Buy): Both RSI values are below the oversold threshold.
Overbought Condition (Sell): Both RSI values are above the overbought threshold.
These conditions are checked only when the chart’s current timeframe matches the active timeframe input for that warning pair.
Signal Triggering:
To avoid repeated signals, the script only marks a signal when the condition is “new” (i.e., it is true on the current bar and was false on the previous bar).
Depending on the condition:
Buy Signal: A tiny upward arrow is plotted below the candle.
Sell Signal: A tiny downward arrow is plotted above the candle.
Alert Conditions:
The script also defines alert conditions that you can use to trigger TradingView alerts when these RSI-based signals occur.
User Manual / Instructions
Adding the Indicator:
Open the Pine Script editor in TradingView.
Copy and paste the provided RSI_MultiTimeFrame code.
Save and add the indicator to your chart.
Configuring the Settings:
RSI Period and Thresholds:
Adjust the RSI period and set the overbought/oversold thresholds to your preference.
Board Timeframes & Position:
Enter the desired timeframes for the RSI board and choose where on the chart you want the table to appear.
Warning Pairs:
For each warning pair (1–5):
Choose two timeframes for calculating the RSI values.
Select the chart timeframe on which you want that pair to be active.
(For example, you might set Warning Pair 1 to use RSI from 1‑minute and 5‑minute data and to be active only when your chart is set to "1".)
Interpreting the Signals:
On the RSI Table:
The table shows the RSI values for the different timeframes. The background color of each cell changes dynamically:
Green when the RSI is low (oversold).
Red when the RSI is high (overbought).
A gradient color for values in between.
On the Chart:
Buy Signal: When the active warning pair’s oversold condition is triggered (RSI values drop below the oversold threshold on that pair), a tiny upward (arrowup) yellow arrow appears below the candle.
Sell Signal: When the active warning pair’s overbought condition is triggered (RSI values rise above the overbought threshold on that pair), a tiny downward (arrowdown) yellow arrow appears above the candle.
The arrow is only shown on the closed candle at the moment the condition changes from false to true.
Setting Alerts (Optional):
Use the built‑in alert conditions (found in the TradingView alert dialog after adding the indicator) to be notified when a new Buy or Sell signal occurs.
Practical Use:
Switching Timeframes:
If you change your chart’s timeframe, only the warning pair that matches that chart timeframe will be monitored for signals.
Signal Confirmation:
Since the indicator only plots arrows when the RSI condition first occurs, you can use the arrow as a starting point for further analysis or to combine with your other trading criteria.
Script protégé
Ce script est publié en source fermée. Toutefois, vous pouvez l'utiliser librement et sans aucune restriction - en savoir plus ici.
Clause de non-responsabilité
Les informations et les publications ne sont pas destinées à être, et ne constituent pas, des conseils ou des recommandations en matière de finance, d'investissement, de trading ou d'autres types de conseils fournis ou approuvés par TradingView. Pour en savoir plus, consultez les Conditions d'utilisation.