OPEN-SOURCE SCRIPT
Interactive trendline
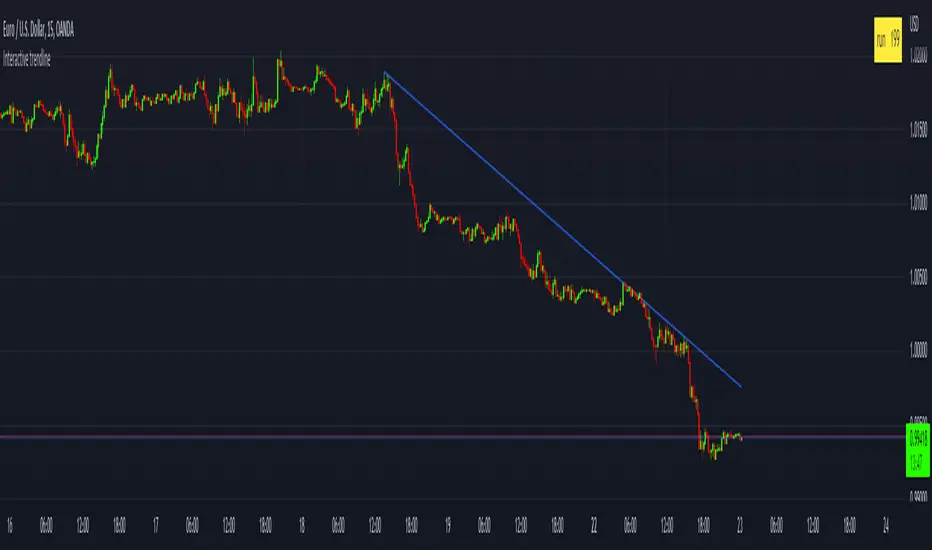
This is a concept that I have been playing with
to make a manual trend line that has more then just two connecting dots
but that has sequential data connected on every bar between the
beginning an the end point that can then be used to determine a break of trend or
a bounce.
This is added in a few simple steps
1) add the indicator to your chart
2) set the x_1 time bar
3) set the y_1 price
4) set the x_2 time bar
5) set the y_2 price
6) check the table that calculated the run value and enter that value in the settings box in the "Run" input box
Script open-source
Dans l'esprit TradingView, le créateur de ce script l'a rendu open source afin que les traders puissent examiner et vérifier ses fonctionnalités. Bravo à l'auteur! Bien que vous puissiez l'utiliser gratuitement, n'oubliez pas que la republication du code est soumise à nos Règles.
Clause de non-responsabilité
Les informations et publications ne sont pas destinées à être, et ne constituent pas, des conseils ou recommandations financiers, d'investissement, de trading ou autres fournis ou approuvés par TradingView. Pour en savoir plus, consultez les Conditions d'utilisation.