OPEN-SOURCE SCRIPT
Earnings Surprise Indicator (Post-Earnings Announcement Drift)
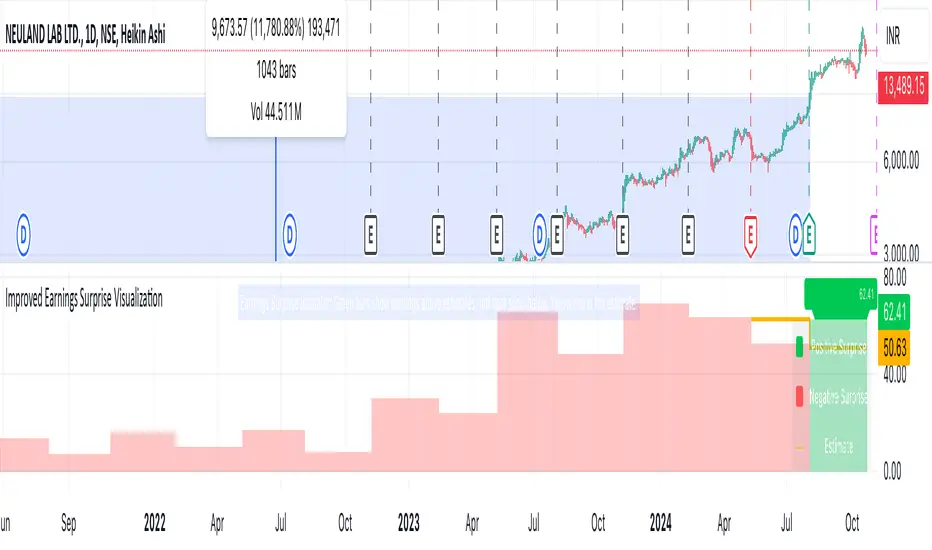
What It Does:
- Displays a company's actual earnings vs. analysts' estimates over time
- Shows "earnings surprises" - when actual results beat or miss expectations
- Helps identify trends in a company's financial performance
How It Works:
- Green bars: Positive surprise (earnings beat estimates)
- Red bars: Negative surprise (earnings missed estimates)
- Yellow line: Analysts' earnings estimates
Correlation with Post Earnings Announcement Drift (PEAD): PEAD is the tendency for a stock's price to drift in the direction of an earnings surprise for several weeks or months after the announcement.
Why It Matters:
- Positive surprises often lead to upward price drift
- Negative surprises often lead to downward price drift
- This drift can create trading opportunities
How to Use It:
1. Spot Trends:
- Consistent beats may indicate strong company performance
- Consistent misses may signal underlying issues
2. Gauge Market Expectations:
- Large surprises may lead to significant price movements
3. Timing Decisions:
- Consider long positions after positive surprises
- Consider short positions or exits after negative surprises
4. Risk Management:
- Be cautious of reversal if the drift seems excessive
- Use in conjunction with other technical and fundamental analysis
Key Takeaways:
- Earnings surprises can be fundamental-leading indicators of future stock performance, especially when correlated with analyst projections
- PEAD suggests that markets often underreact to earnings news initially
- This indicator helps visualize the magnitude and direction of surprises
- It can be a valuable tool for timing entry and exit points in trades
Script open-source
Dans l'esprit TradingView, le créateur de ce script l'a rendu open source afin que les traders puissent examiner et vérifier ses fonctionnalités. Bravo à l'auteur! Bien que vous puissiez l'utiliser gratuitement, n'oubliez pas que la republication du code est soumise à nos Règles.
Clause de non-responsabilité
Les informations et publications ne sont pas destinées à être, et ne constituent pas, des conseils ou recommandations financiers, d'investissement, de trading ou autres fournis ou approuvés par TradingView. Pour en savoir plus, consultez les Conditions d'utilisation.