OPEN-SOURCE SCRIPT
One Year Return
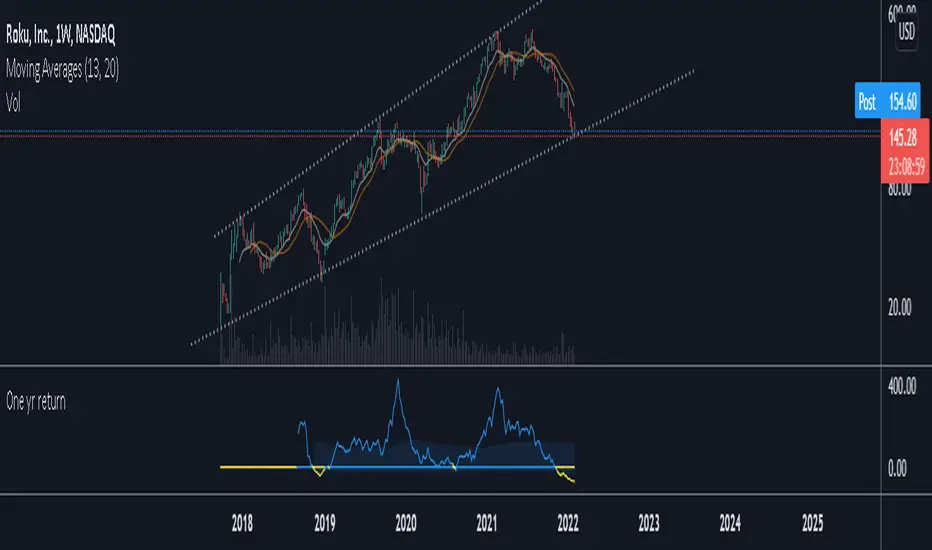
This is a script meant for the weekly timeframe . It shows the change between the current close and the close 52 bars ago. I find that this data can be useful for deciding how long to stay in a trade, and for deciding how far a stock is likely to move in a year based on it's historical returns. The High average takes the sum of all positive returns and averages it using the number of bars where the data was positive, the low average does the same but with all the returns below zero. When both are turned on you will see a band between these values.
Script open-source
Dans l'esprit TradingView, le créateur de ce script l'a rendu open source afin que les traders puissent examiner et vérifier ses fonctionnalités. Bravo à l'auteur! Bien que vous puissiez l'utiliser gratuitement, n'oubliez pas que la republication du code est soumise à nos Règles.
Clause de non-responsabilité
Les informations et publications ne sont pas destinées à être, et ne constituent pas, des conseils ou recommandations financiers, d'investissement, de trading ou autres fournis ou approuvés par TradingView. Pour en savoir plus, consultez les Conditions d'utilisation.