OPEN-SOURCE SCRIPT
Mis à jour Macro Timeframes with Opening Price
Description: Macro Timeframe Horizontal Line Indicator
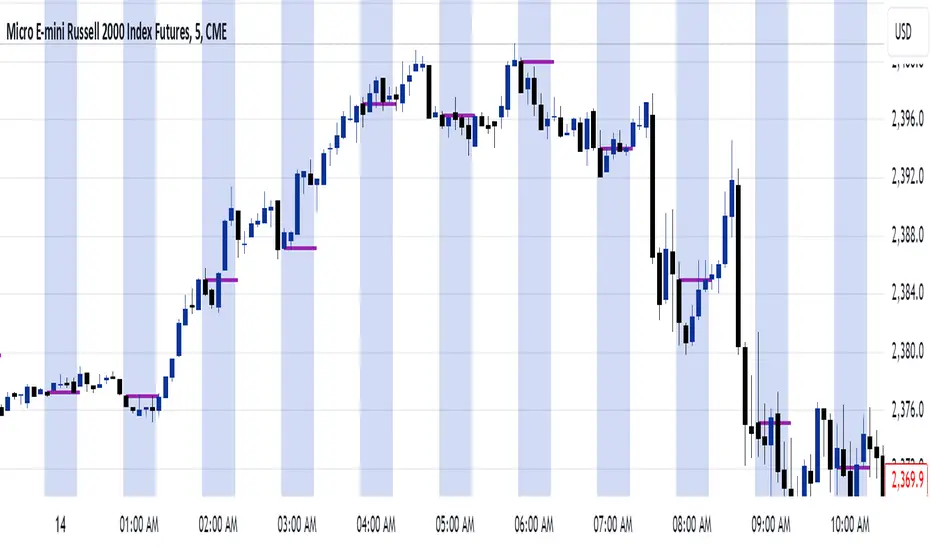
This indicator highlights macro periods on the chart by drawing a horizontal line at the opening price of each macro period. The macro timeframe is defined as the last 10 minutes of an hour (from :50 to :00) and the first 10 minutes of the following hour (from :00 to :10).
A horizontal black line is plotted at the opening price of the macro period, starting at :50 and extending through the duration of the macro window. However, you can customize it however you see fit.
The background of the macro period is highlighted with a customizable color to visually distinguish the timeframe.
The horizontal line updates at each macro period, ensuring that the opening price for every macro session is accurately reflected on the chart.
This tool is useful for traders who want to track the behavior of price within key macro intervals and visually assess price movement and volatility during these periods.
Notes de version
This script highlights macro periods on the chart and draws a line representing the open of the macro.The background highlight is visible on the chart when the timeframe is 15 mins or less.
The length of the macros opening price is also adjusted so it is variable with the timeframe. Shorter lengths for the higher timeframes while longer lengths for the lower timeframes.
Notes de version
I adjusted the length again to account for the timeframes <1 minuteNotes de version
Added in the ability to change the color and thickness of the line of the MOP.Script open-source
Dans l'esprit TradingView, le créateur de ce script l'a rendu open source afin que les traders puissent examiner et vérifier ses fonctionnalités. Bravo à l'auteur! Bien que vous puissiez l'utiliser gratuitement, n'oubliez pas que la republication du code est soumise à nos Règles.
Clause de non-responsabilité
Les informations et publications ne sont pas destinées à être, et ne constituent pas, des conseils ou recommandations financiers, d'investissement, de trading ou autres fournis ou approuvés par TradingView. Pour en savoir plus, consultez les Conditions d'utilisation.
Script open-source
Dans l'esprit TradingView, le créateur de ce script l'a rendu open source afin que les traders puissent examiner et vérifier ses fonctionnalités. Bravo à l'auteur! Bien que vous puissiez l'utiliser gratuitement, n'oubliez pas que la republication du code est soumise à nos Règles.
Clause de non-responsabilité
Les informations et publications ne sont pas destinées à être, et ne constituent pas, des conseils ou recommandations financiers, d'investissement, de trading ou autres fournis ou approuvés par TradingView. Pour en savoir plus, consultez les Conditions d'utilisation.