OPEN-SOURCE SCRIPT
Mis à jour Rolling Volatility Indicator

Description:
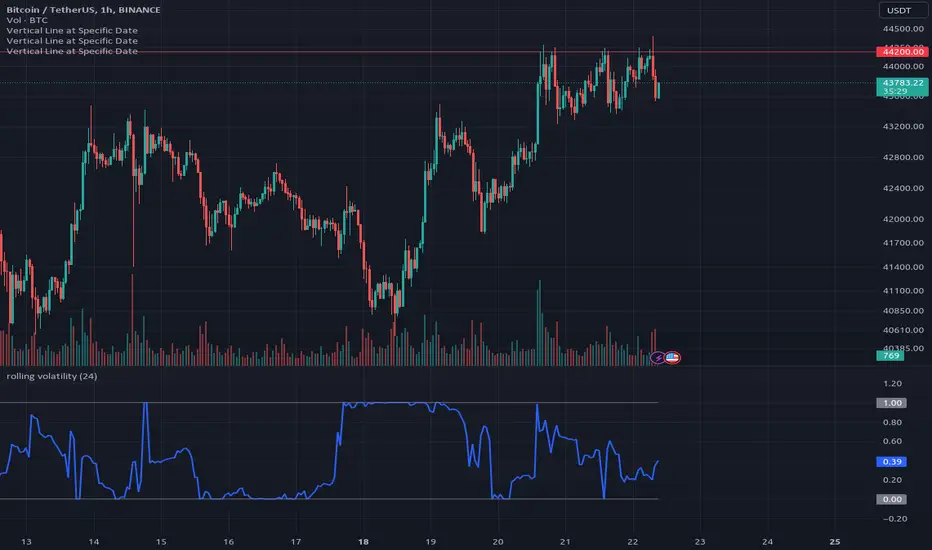
The Rolling Volatility indicator calculates the volatility of an asset's price movements over a specified period. It measures the degree of variation in the price series over time, providing insights into the market's potential for price fluctuations.
This indicator utilizes a rolling window approach, computing the volatility by analyzing the logarithmic returns of the asset's price. The user-defined length parameter determines the timeframe for the volatility calculation.
How to Use:
- Adjust the "Length" parameter to set the rolling window period for volatility calculation.
- Ajust "trading_days" for the sampling period, this is the total number of trading days (usually 252 days for stocks and 365 for crypto)
- Higher values for the length parameter will result in a smoother, longer-term view of volatility, while lower values will provide a more reactive, shorter-term perspective.
- Volatility levels can assist in identifying periods of increased market activity or potential price changes. Higher volatility may suggest increased risk and potential opportunities, while lower volatility might indicate periods of reduced market activity.
Key Features:
- Customizable length parameter for adjusting the calculation period and trading days such that it can also be applied to stock market or any markets.
- Visual representation of volatility with a plotted line on the chart.
The Rolling Volatility indicator can be a valuable tool for traders and analysts seeking insights into market volatility trends, aiding in decision-making processes and risk management strategies.
Notes de version
Description:The Rolling Volatility indicator calculates the volatility of an asset's price movements over a specified period. It measures the degree of variation in the price series over time, providing insights into the market's potential for price fluctuations.
This indicator utilizes a rolling window approach, computing the volatility by analyzing the logarithmic returns of the asset's price. The user-defined length parameter determines the timeframe for the volatility calculation.
How to Use:
- Adjust the "Length" parameter to set the rolling window period for volatility calculation.
- Higher values for the length parameter will result in a smoother, longer-term view of volatility, while lower values will provide a more reactive, shorter-term perspective.
- Volatility levels can assist in identifying periods of increased market activity or potential price changes. Higher volatility may suggest increased risk and potential opportunities, while lower volatility might indicate periods of reduced market activity.
Key Features:
- Customizable length parameter for adjusting the calculation period and trading days such that it can also be applied to stock market or any markets.
- Visual representation of volatility with a plotted line on the chart.
The Rolling Volatility indicator can be a valuable tool for traders and analysts seeking insights into market volatility trends, aiding in decision-making processes and risk management strategies.
CHANGELOG:
- Removed the "trading_days" parameters. It is now inferred directly from the asset under study. By default it will take a trading days period of 255 and will automatically adjust to 365 for crypto.
Notes de version
CHANGELOG:Normalize the rolling volatility index between [0.0, 1.0]
This make more sense for very low or high price asset where the index could be very low or high and this makes difficult to interpret was it means.
NOTE: this is still possible to switch back to the previous computation by unticking the normalize checkbox in the indicator option.
Script open-source
Dans l'esprit TradingView, le créateur de ce script l'a rendu open source afin que les traders puissent examiner et vérifier ses fonctionnalités. Bravo à l'auteur! Bien que vous puissiez l'utiliser gratuitement, n'oubliez pas que la republication du code est soumise à nos Règles.
Clause de non-responsabilité
Les informations et publications ne sont pas destinées à être, et ne constituent pas, des conseils ou recommandations financiers, d'investissement, de trading ou autres fournis ou approuvés par TradingView. Pour en savoir plus, consultez les Conditions d'utilisation.