OPEN-SOURCE SCRIPT
Mis à jour MACD with DPO Strategy by NG
Explanation of the MACD with DPO Strategy:
MACD (Moving Average Convergence Divergence):
The MACD is a trend-following indicator that shows the relationship between two moving averages of a price.
In this script:
We calculate the MACD line by subtracting the slow moving average (typically 26-period EMA) from the fast moving average (typically 12-period EMA).
The Signal line is calculated as a 9-period EMA of the MACD line.
The Histogram is the difference between the MACD line and the Signal line, indicating the momentum of the price trend.
Buy Condition: The script generates a buy signal when the MACD histogram crosses from negative to positive (indicating a bullish momentum) and DPO is also positive.
Sell Condition: The script generates a sell signal when the MACD histogram crosses from positive to negative (indicating a bearish momentum) and DPO is also negative.
DPO (Detrended Price Oscillator):
The DPO removes long-term trends from prices, making it easier to identify shorter-term cycles or oscillations.
In this script:
We calculate the DPO by subtracting a shifted simple moving average (SMA) from the close price. The shifting period depends on half the specified period.
We also calculate the DPO SMA as a 30-period EMA of the DPO values.
DPO Color: The DPO line is colored green when the DPO is above zero (indicating upward momentum) and red when it is below zero (indicating downward momentum). The histogram is also colored based on whether the DPO is positive or negative.
Plotting and Alerts:
The script plots the MACD, Signal, and Histogram on the chart.
Additionally, it plots the DPO and its SMA with different colors depending on whether the DPO is above or below zero.
Buy Signal: A green arrow labeled "BUY" is plotted below the bar when both MACD and DPO indicate a bullish condition.
Sell Signal: A red arrow labeled "SELL" is plotted above the bar when both MACD and DPO indicate a bearish condition.
Background colors are used to highlight the chart whenever a buy or sell condition occurs.
The script also includes alerts for both buy and sell signals, allowing users to set notifications when conditions are met.
How to Use:
Identify Buy and Sell Signals:
The script generates a Buy signal when:
The MACD histogram crosses from negative to positive (bullish momentum), and
The DPO is above zero (indicating upward momentum).
The script generates a Sell signal when:
The MACD histogram crosses from positive to negative (bearish momentum), and
The DPO is below zero (indicating downward momentum).
Chart Visualization:
The MACD histogram and Signal line help visualize the momentum and potential trend reversal.
The DPO and DPO SMA help visualize the shorter-term price cycles.
The signals (Buy and Sell) will be plotted on the chart with arrows indicating entry points.
Customization:
You can adjust the MACD and DPO parameters (such as fast_length, slow_length, period_) to fit your trading style or market conditions.
The script can be used in any timeframe depending on your strategy (e.g., intraday trading or longer-term trading).
Example Scenario:
If you're looking for potential buy opportunities, wait for the script to generate a buy signal (green arrow) where the MACD histogram has shifted to positive, and DPO is also in the green (above zero). This signals that both momentum and cycle direction are aligned for a potential upward movement.
Conversely, for sell opportunities, wait for the red arrow where MACD momentum is turning negative and DPO is also negative (below zero), indicating a bearish condition.
This combination of MACD and DPO allows traders to identify stronger and more reliable entry/exit points by confirming the trend with the MACD and detecting shorter-term price cycles with the DPO.
Notes de version
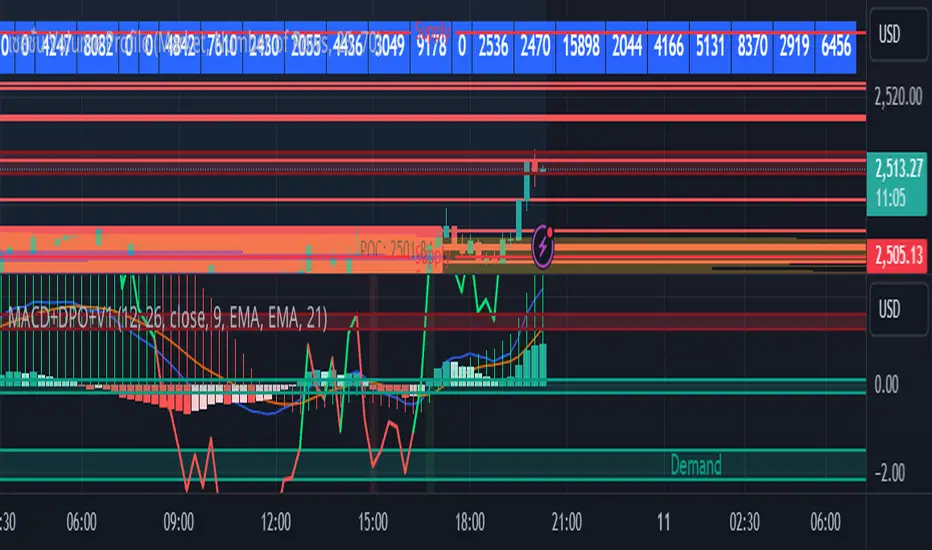
Histogram Color Update:This script combines the MACD (Moving Average Convergence Divergence) indicator with the DPO (Detrended Price Oscillator) to generate buy/sell signals and visualize them with updated histogram colors.
How to Use the Indicator:
MACD Analysis:
The MACD line and signal line are used to track momentum in the market.
When the MACD histogram crosses from negative to positive, it indicates a potential buy signal.
When the MACD histogram crosses from positive to negative, it suggests a sell signal.
DPO Analysis:
The DPO helps to remove long-term trends and focuses on shorter-term price cycles.
If the DPO is above zero, it suggests bullish momentum.
If the DPO is below zero, it indicates bearish momentum.
Color-Coded Histogram:
The MACD histogram is color-coded to show trend strength:
Dark green for strong positive movement.
Light green for weakening positive movement.
Dark red for strong negative movement.
Light red for weakening negative movement.
Buy and Sell Conditions:
A buy signal occurs when the MACD histogram crosses from negative to positive, and the DPO is positive.
A sell signal occurs when the MACD histogram crosses from positive to negative, and the DPO is negative.
Visual Alerts:
Buy signals are displayed as green labels with "BUY" below the chart.
Sell signals are displayed as red labels with "SELL" above the chart.
Background Highlights:
The background of the chart will be highlighted green when a buy condition is met and red when a sell condition is met for better visualization.
By combining both the MACD and DPO, this strategy helps you capture market momentum changes and identify optimal entry and exit points.
Script open-source
Dans l'esprit TradingView, le créateur de ce script l'a rendu open source afin que les traders puissent examiner et vérifier ses fonctionnalités. Bravo à l'auteur! Bien que vous puissiez l'utiliser gratuitement, n'oubliez pas que la republication du code est soumise à nos Règles.
Clause de non-responsabilité
Les informations et publications ne sont pas destinées à être, et ne constituent pas, des conseils ou recommandations financiers, d'investissement, de trading ou autres fournis ou approuvés par TradingView. Pour en savoir plus, consultez les Conditions d'utilisation.