OPEN-SOURCE SCRIPT
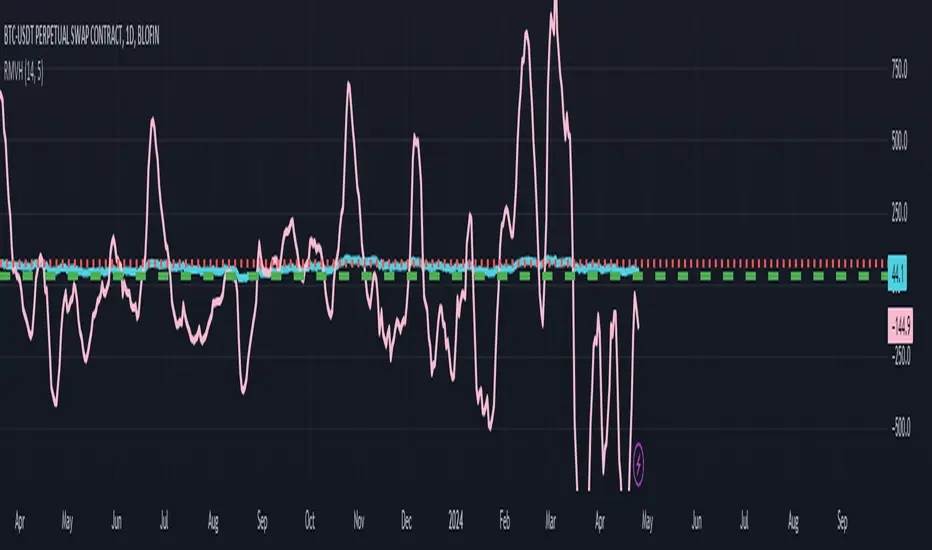
RMVH by mycroftlearnstotrade

The RMVH indicator combines several popular technical analysis tools to provide a comprehensive view of market conditions. It includes Relative Strength Index (RSI), Moving Average Convergence Divergence (MACD), Volume, and Smoothed Heiken Ashi.
RSI (Relative Strength Index):
The RSI measures the strength and speed of price movements. It oscillates between 0 and 100, with levels above 70 indicating overbought conditions and levels below 30 indicating oversold conditions.
MACD (Moving Average Convergence Divergence):
The MACD is a trend-following momentum indicator that shows the relationship between two moving averages of a security’s price. It consists of the MACD line (the difference between a short-term and a long-term moving average) and the signal line (a moving average of the MACD line). The MACD histogram represents the difference between the MACD line and the signal line.
Volume:
The volume displays the total trading volume over a specified period. It helps traders gauge the strength or weakness of price movements. Typically, high volume accompanies strong price moves, while low volume may signal a lack of conviction in the market.
Smoothed Heiken Ashi:
The Smoothed Heiken Ashi is a variation of Japanese candlestick charts that aims to filter out market noise and highlight trends more effectively. It is calculated based on the open, high, low, and close prices, resulting in smoother candlesticks compared to traditional candlestick charts.
Usage:
Traders can use the RMVH indicator to identify potential trend reversals, overbought or oversold conditions, and divergence between price and momentum. Additionally, the volume component can help confirm the strength of price movements, while the Smoothed Heiken Ashi can provide a clearer visualization of trends.
Bullish signals may occur when the RSI and MACD indicate oversold conditions, accompanied by high volume and rising Smoothed Heiken Ashi values. Conversely, bearish signals may occur when the RSI and MACD indicate overbought conditions, accompanied by high volume and declining Smoothed Heiken Ashi values.
Note:
While the RMVH indicator combines multiple technical analysis tools, traders should exercise caution and use additional analysis to confirm signals before making trading decisions. No indicator is foolproof, and market conditions can change rapidly.
Clause de non-responsabilité
Les informations et les publications ne sont pas destinées à être, et ne constituent pas, des conseils ou des recommandations en matière de finance, d'investissement, de trading ou d'autres types de conseils fournis ou approuvés par TradingView. Pour en savoir plus, consultez les Conditions d'utilisation.