OPEN-SOURCE SCRIPT
Revolution SMA-EMA Divergence
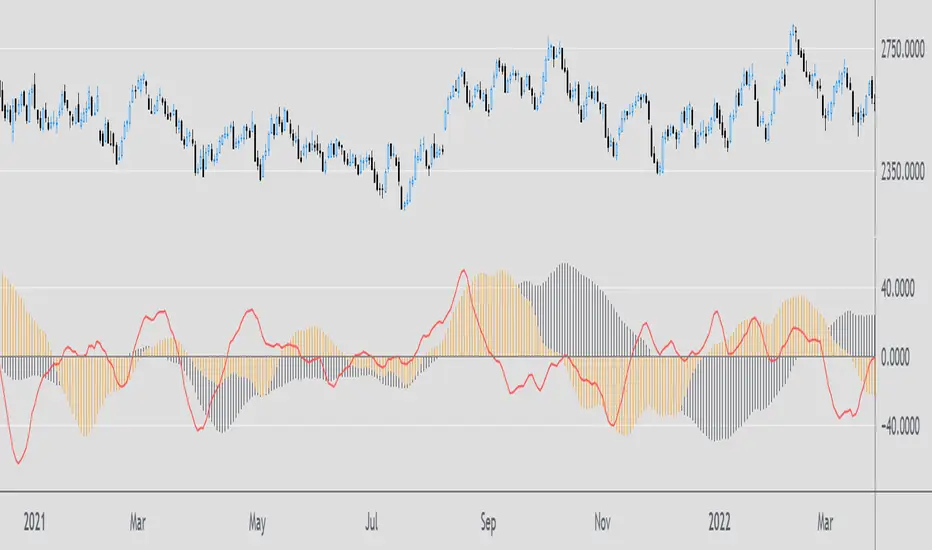
This is an MACD inspired indicator and it analyzes the difference between the SMA and EMA using the same time period. Unlike the MACD, it can give you a better understanding of the overall trend. Values above 0 is bullish and below 0 bearish. It consists of two cycles: Black histogram - the long-term cycle and orange histogram - the short-term cycle, as well as timing signal (red line).
Script open-source
Dans l'esprit TradingView, le créateur de ce script l'a rendu open source afin que les traders puissent examiner et vérifier ses fonctionnalités. Bravo à l'auteur! Bien que vous puissiez l'utiliser gratuitement, n'oubliez pas que la republication du code est soumise à nos Règles.
Clause de non-responsabilité
Les informations et publications ne sont pas destinées à être, et ne constituent pas, des conseils ou recommandations financiers, d'investissement, de trading ou autres fournis ou approuvés par TradingView. Pour en savoir plus, consultez les Conditions d'utilisation.