OPEN-SOURCE SCRIPT
Bankruptcy Risk: Altman Z-Score, Zmijewski Score, Grover G
This custom indicator calculates three common bankruptcy risk scores:
Altman Z-Score
Zmijewski Score
Grover Model: G-Score
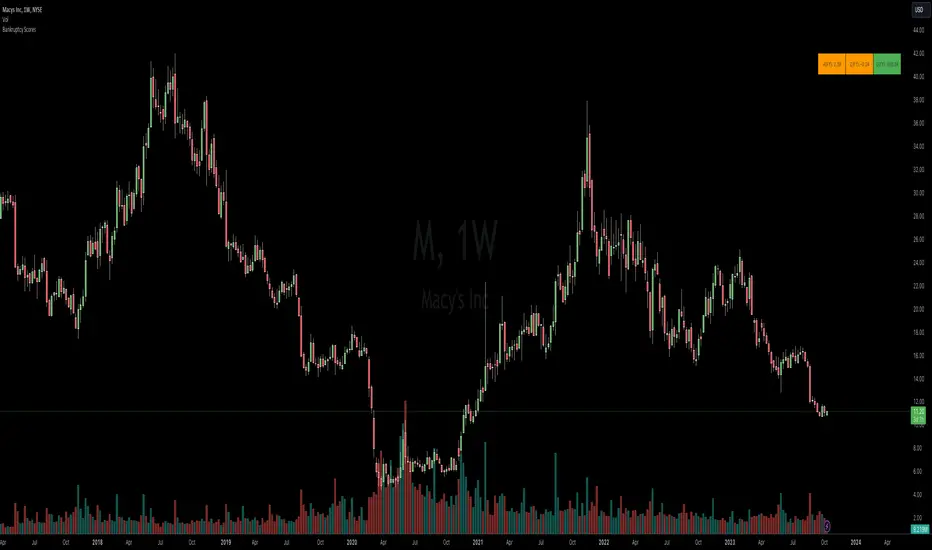
The indicator pulls key financial metrics and calculates each score, then displays the results in a table with color-coding based on the level of bankruptcy risk.
Users can toggle between FQ and FY periods and view details on the underlying metrics. This provides an easy way to visualize bankruptcy risk for a company and compare across different scoring models.
Useful for fundamental analysis and assessing financial health.
The financial ratios and methodology are based on research described in
"Analysis of Bankruptcy Prediction Models in Determining Bankruptcy of Consumer Goods Companies in Indonesia" (Thomas et al., 2020).
- Altman Z-Score
- Zmijewski Score
- Grover G-Score
Altman Z-Score
- Companies are in healthy condition if the Z-Score > 2.6.
- Companies are in vulnerable conditions and need improvement (grey area) if the score is between 1.1 - 2.6.
- Companies have the potential to lead to serious bankruptcy if the Z-Score < 1.1.
Zmijewski Score
- The company has the potential to go bankrupt if the value of X Score > 0.
- The company is healthy if the value of X Score < 0.
Grover Model: G-Score
- The company has the potential to go bankrupt if the G Score ≤ -0.02.
- The company is in good health if the value of G Score ≥ 0.001.
The indicator pulls key financial metrics and calculates each score, then displays the results in a table with color-coding based on the level of bankruptcy risk.
Users can toggle between FQ and FY periods and view details on the underlying metrics. This provides an easy way to visualize bankruptcy risk for a company and compare across different scoring models.
Useful for fundamental analysis and assessing financial health.
The financial ratios and methodology are based on research described in
"Analysis of Bankruptcy Prediction Models in Determining Bankruptcy of Consumer Goods Companies in Indonesia" (Thomas et al., 2020).
Script open-source
Dans l'esprit TradingView, le créateur de ce script l'a rendu open source afin que les traders puissent examiner et vérifier ses fonctionnalités. Bravo à l'auteur! Bien que vous puissiez l'utiliser gratuitement, n'oubliez pas que la republication du code est soumise à nos Règles.
Clause de non-responsabilité
Les informations et publications ne sont pas destinées à être, et ne constituent pas, des conseils ou recommandations financiers, d'investissement, de trading ou autres fournis ou approuvés par TradingView. Pour en savoir plus, consultez les Conditions d'utilisation.