OPEN-SOURCE SCRIPT
Mis à jour SAT - Sentiment Analysis Tool by Csth97
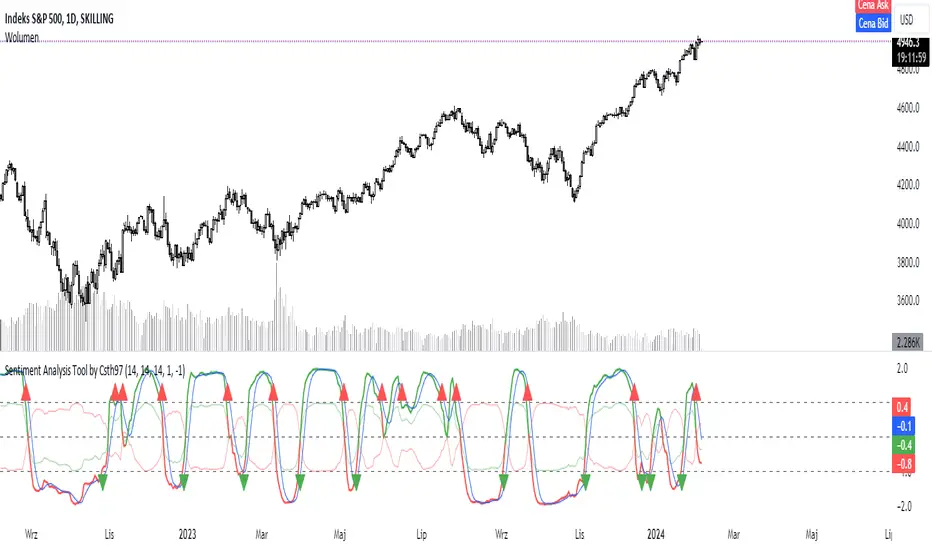
This code calculates the correlation between the ATR and the OBV of the price, and plots the difference between the positive and negative OBV correlations as a line. It also plots horizontal lines at the UP and DOWN levels, and signals bullish and bearish crosses when the difference line crosses those levels.
Notes de version
// This code calculates the correlation between the ATR and the OBV of the price, and plots the difference between the positive and negative OBV correlations as a line.//It also plots horizontal lines at the UP and DOWN levels, and signals bullish and bearish crosses when the difference line crosses those levels.
Script open-source
Dans l'esprit TradingView, le créateur de ce script l'a rendu open source afin que les traders puissent examiner et vérifier ses fonctionnalités. Bravo à l'auteur! Bien que vous puissiez l'utiliser gratuitement, n'oubliez pas que la republication du code est soumise à nos Règles.
Clause de non-responsabilité
Les informations et publications ne sont pas destinées à être, et ne constituent pas, des conseils ou recommandations financiers, d'investissement, de trading ou autres fournis ou approuvés par TradingView. Pour en savoir plus, consultez les Conditions d'utilisation.