OPEN-SOURCE SCRIPT
Catastrophe Distance
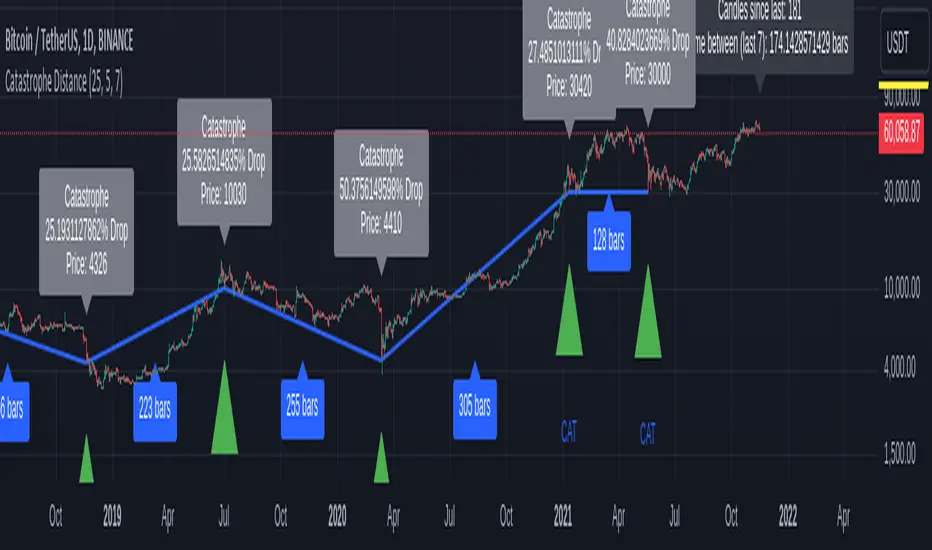
Catastrophe Distance is a tool to visually explore the time between catastrophic price moves.
Catastrophes are defined with 2 variables:
drawdown_threshold: the amount of percent the price has to fall
lookback_period = the amount of last candles in which drawdown_threshold was reached.
Drawdown_threshold per default is 25% and lookback_period is 5, meaning per default if price moves -25% in the last 5 candles you have a catastrophe.
Feel free to play around with this values to fit all the events you consider a catastrophe.
This indicator does not provide signals. It however implies caution if the time since the last catastrophe is higher then the average time between catastrophes (of last x catastrophes).
This is marked by the label over the current price showing the actual and average time since last catastrophe turning from green to black.
Given that the distance between catastrophes is somewhat cyclical:
Maybe now is a good time to start phishing for low limit orders and reduce leverage?
Script open-source
Dans l'esprit TradingView, le créateur de ce script l'a rendu open source afin que les traders puissent examiner et vérifier ses fonctionnalités. Bravo à l'auteur! Bien que vous puissiez l'utiliser gratuitement, n'oubliez pas que la republication du code est soumise à nos Règles.
Clause de non-responsabilité
Les informations et publications ne sont pas destinées à être, et ne constituent pas, des conseils ou recommandations financiers, d'investissement, de trading ou autres fournis ou approuvés par TradingView. Pour en savoir plus, consultez les Conditions d'utilisation.