OPEN-SOURCE SCRIPT
Mis à jour RaenonX - NQ 7 Dashboard
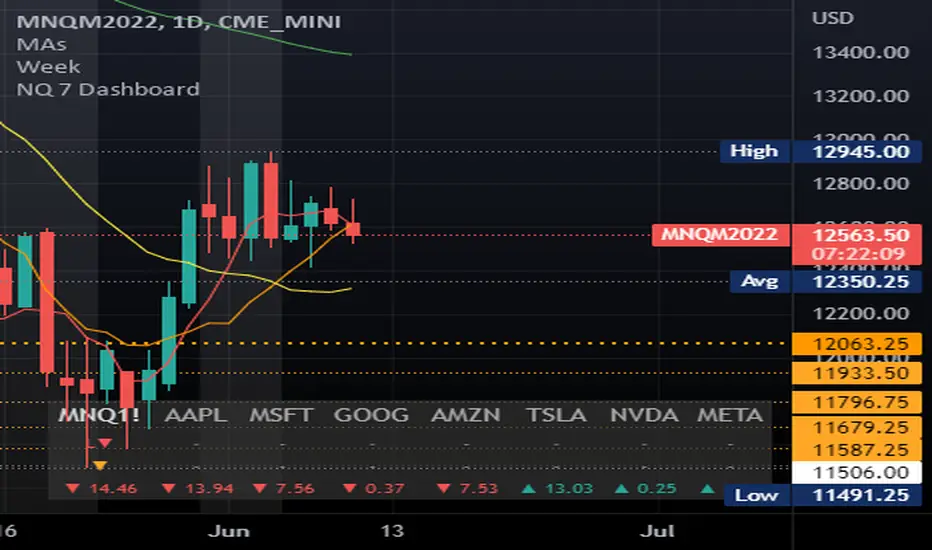
Places a table at the bottom right side showing the top 7 stocks (AAPL, MSFT, GOOG, AMZN, TSLA, NVDA, FB) current position for the given MA and daily position.
The 2nd row shows the current position related to the prior day open/high/low. There are 4 possible values:
The 3rd row shows the current position related to the given SMA parameters. The default period is 22 using 5 minutes timeframe. There are 4 possible values:
The 2nd row shows the current position related to the prior day open/high/low. There are 4 possible values:
- H+: Higher than the prior day high - indicates bullish in daily timeframe.
- O+: Higher than the prior day open - indicates pro-bullish consolidation in daily timeframe.
- L+: Higher than the prior day low - indicates pro-bearish consolidation in daily timeframe.
- L-: Lower than the prior day high - indicates bearish in daily timeframe.
The 3rd row shows the current position related to the given SMA parameters. The default period is 22 using 5 minutes timeframe. There are 4 possible values:
- B+: Higher than the SMA upper band - indicates bullish movement.
- +: Higher than the SMA - indicates pro-bullish movement, possibly consolidating.
- -: Lower than the SMA - indicates pro-bearish movement, possibly consolidating.
- B-: Lower than the SMA lower band - indicates bearish movement.
Notes de version
Updated band StDev input step.Notes de version
Updated symbols & disabled stock out of regular session regardless the settings. Notes de version
Added index influence value & Optimized performance.Notes de version
Hides main 7 stocks of NDX out of stock trading session (including pre-market and post-market).Notes de version
Replaced position buffering mechanism with Amplitude (was using the same mechanism of Bollinger Bands).Notes de version
Updated ticker from FB to META.Script open-source
Dans l'esprit de TradingView, le créateur de ce script l'a rendu open-source, afin que les traders puissent examiner et vérifier sa fonctionnalité. Bravo à l'auteur! Vous pouvez l'utiliser gratuitement, mais n'oubliez pas que la republication du code est soumise à nos Règles.
Clause de non-responsabilité
Les informations et les publications ne sont pas destinées à être, et ne constituent pas, des conseils ou des recommandations en matière de finance, d'investissement, de trading ou d'autres types de conseils fournis ou approuvés par TradingView. Pour en savoir plus, consultez les Conditions d'utilisation.
Script open-source
Dans l'esprit de TradingView, le créateur de ce script l'a rendu open-source, afin que les traders puissent examiner et vérifier sa fonctionnalité. Bravo à l'auteur! Vous pouvez l'utiliser gratuitement, mais n'oubliez pas que la republication du code est soumise à nos Règles.
Clause de non-responsabilité
Les informations et les publications ne sont pas destinées à être, et ne constituent pas, des conseils ou des recommandations en matière de finance, d'investissement, de trading ou d'autres types de conseils fournis ou approuvés par TradingView. Pour en savoir plus, consultez les Conditions d'utilisation.