OPEN-SOURCE SCRIPT
Mis à jour RSI - EMA - WMA ( Phat-Truong )
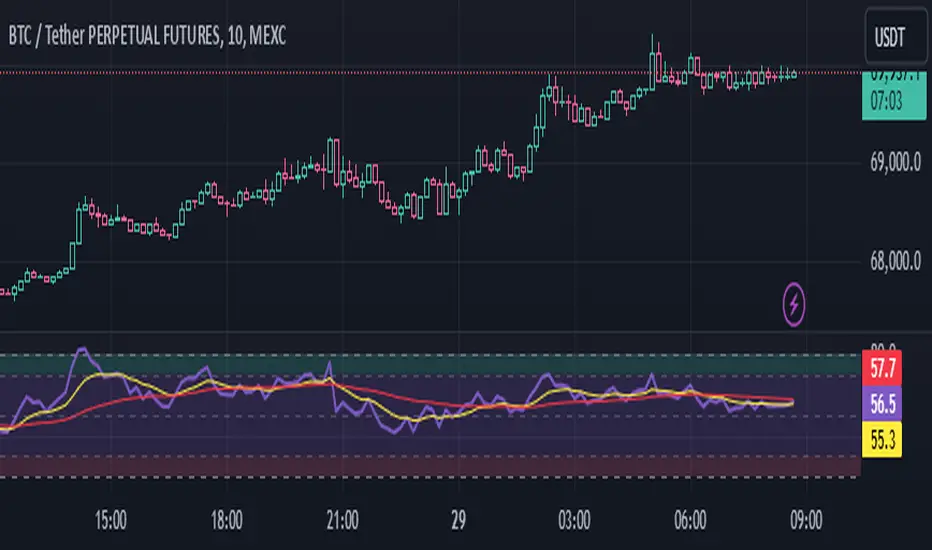
Indicator: RSI ( EMA - WMA )
This indicator, named "RSI ( EMA - WMA )", is a versatile tool designed to provide insights into market momentum and trend strength by combining multiple technical indicators.
The Relative Strength Index (RSI) is a popular momentum oscillator used to measure the speed and change of price movements. In this indicator, RSI is plotted alongside its Exponential Moving Average (EMA) and Weighted Moving Average (WMA). EMA and WMA are smoothing techniques applied to RSI to help identify trends more clearly.
Key features of this indicator include:
RSI: The main RSI line is plotted on the chart, offering insights into overbought and oversold conditions.
EMA of RSI: The Exponential Moving Average of RSI smooths out short-term fluctuations, aiding in trend identification.
WMA of RSI: The Weighted Moving Average of RSI gives more weight to recent data points, providing a faster response to price changes.
Additionally, this indicator marks specific RSI levels considered as bullish and bearish trends, helping traders identify potential entry or exit points based on market sentiment.
By combining these technical indicators, traders can gain a comprehensive understanding of market dynamics, helping them make more informed trading decisions.
Notes de version
Indicator: RSI ( EMA - WMA )This indicator, named "RSI ( EMA - WMA )", is a versatile tool designed to provide insights into market momentum and trend strength by combining multiple technical indicators.
The Relative Strength Index (RSI) is a popular momentum oscillator used to measure the speed and change of price movements. In this indicator, RSI is plotted alongside its Exponential Moving Average (EMA) and Weighted Moving Average (WMA). EMA and WMA are smoothing techniques applied to RSI to help identify trends more clearly.
Key features of this indicator include:
RSI: The main RSI line is plotted on the chart, offering insights into overbought and oversold conditions.
EMA of RSI: The Exponential Moving Average of RSI smooths out short-term fluctuations, aiding in trend identification.
WMA of RSI: The Weighted Moving Average of RSI gives more weight to recent data points, providing a faster response to price changes.
Additionally, this indicator marks specific RSI levels considered as bullish and bearish trends, helping traders identify potential entry or exit points based on market sentiment.
By combining these technical indicators, traders can gain a comprehensive understanding of market dynamics, helping them make more informed trading decisions.
Notes de version
Update IndicatorScript open-source
Dans l'esprit de TradingView, le créateur de ce script l'a rendu open-source, afin que les traders puissent examiner et vérifier sa fonctionnalité. Bravo à l'auteur! Vous pouvez l'utiliser gratuitement, mais n'oubliez pas que la republication du code est soumise à nos Règles.
Pour un accès rapide sur un graphique, ajoutez ce script à vos favoris - en savoir plus ici.
Clause de non-responsabilité
Les informations et les publications ne sont pas destinées à être, et ne constituent pas, des conseils ou des recommandations en matière de finance, d'investissement, de trading ou d'autres types de conseils fournis ou approuvés par TradingView. Pour en savoir plus, consultez les Conditions d'utilisation.
Script open-source
Dans l'esprit de TradingView, le créateur de ce script l'a rendu open-source, afin que les traders puissent examiner et vérifier sa fonctionnalité. Bravo à l'auteur! Vous pouvez l'utiliser gratuitement, mais n'oubliez pas que la republication du code est soumise à nos Règles.
Pour un accès rapide sur un graphique, ajoutez ce script à vos favoris - en savoir plus ici.
Clause de non-responsabilité
Les informations et les publications ne sont pas destinées à être, et ne constituent pas, des conseils ou des recommandations en matière de finance, d'investissement, de trading ou d'autres types de conseils fournis ou approuvés par TradingView. Pour en savoir plus, consultez les Conditions d'utilisation.