OPEN-SOURCE SCRIPT
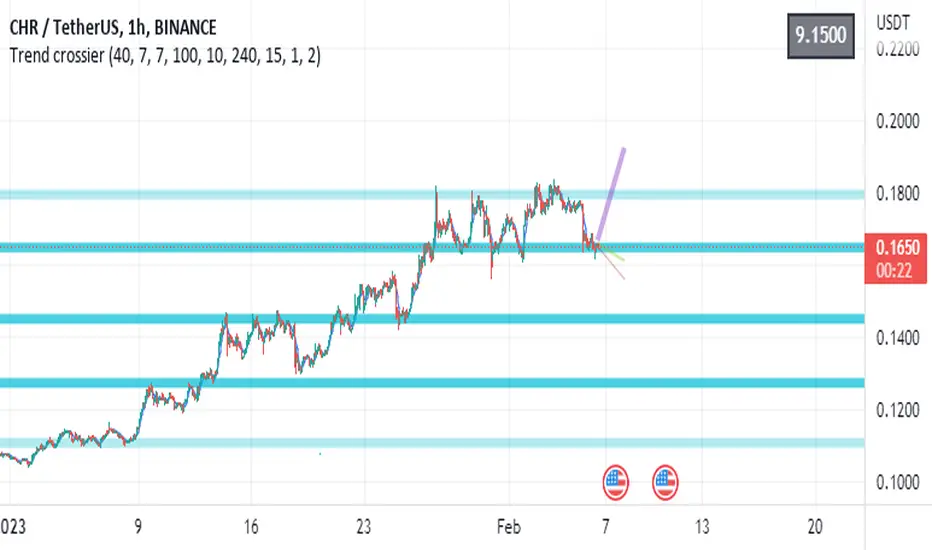
Trend crossier
Hello there!
I would like to share my script.
This is S/R levels indicator based on custom range for each step used for computing minimum/maximum of the range.
For example - we predefined step with 50 candles as one, after we have got the minimum and maximum of it - we come to the next 50 candles and do the same to it.
Finaly - we have got 20 lines for 10 steps.
After that - we set the ( SMA * mult) to have step between lines and if N of lines in range of step from eachother(if a+step > b and b+step > c ...) we call it a strong level.
It is not my idea(but my code), so I do not claim the uniqueness of this idea (the customer asked me to code it, but I also read about this method in open sources before).
The second thing - vectors of current trend direction on different timeframes.
For this task I took the same ranges, but ema () of each range. After first step it has an array with N values.
The next thing it does is take out "chain" one by one on each iteration. How does it do that? We take new AVG with neighbor values.
If we have 10 length at start - after iteration it becomes 9. So it repeats computing till length is 2.
After we have 2 points left - we can plot the line using indexes.
This way we can see the trend direction on different timeframes.
Feel free to use, change, put into another scripts. You can even never use it!
The right to publish this particular code was issued by the customer.
Have fun!
Script open-source
Dans l'esprit TradingView, le créateur de ce script l'a rendu open source afin que les traders puissent examiner et vérifier ses fonctionnalités. Bravo à l'auteur! Bien que vous puissiez l'utiliser gratuitement, n'oubliez pas que la republication du code est soumise à nos Règles.
Clause de non-responsabilité
Les informations et publications ne sont pas destinées à être, et ne constituent pas, des conseils ou recommandations financiers, d'investissement, de trading ou autres fournis ou approuvés par TradingView. Pour en savoir plus, consultez les Conditions d'utilisation.