OPEN-SOURCE SCRIPT
Mis à jour Dynamic Gradient Filter
Sigmoid Functions:
[d1]History and Mathematical Basis:[/d1]
- Sigmoid functions have a rich history in mathematics and are widely used in various fields, including statistics, machine learning, and signal processing.
- The term "sigmoid" originates from the Greek words "sigma" (meaning "S-shaped") and "eidos" (meaning "form" or "type").
- The sigmoid curve is characterized by its smooth S-shaped appearance, which allows it to map any real-valued input to a bounded output range, typically between 0 and 1.
- The most common form of the sigmoid function is the logistic function:
[d1]Logistic Function (σ):[/d1]
- Defined as σ(x) = 1 / (1 + e^(-x)), where:
'x' is the input value,
'e' is Euler's number (approximately 2.71828).
- This function was first introduced by Belgian mathematician Pierre François Verhulst in the 1830s to model population growth with limiting factors.
- It gained popularity in the early 20th century when statisticians like Ronald Fisher began using it in regression analysis.
Specific Sigmoid Functions Used in the Indicator:
- sig(val):
The 'sig' function in this indicator is a modified version of the logistic function, clamping a value between 0 and 1 on the sigmoid curve.
- siga(val):
The 'siga' function adjusts values between -1 and 1 on the sigmoid curve, offering a centered variation of the sigmoid effect.
- sigmoid(val):
The 'sigmoid' function provides a standard implementation of the logistic function, calculating the sigmoid value of the input data.
Adaptive Smoothing Factor:
The 'adaptiveSmoothingFactor(gradient, k)' function computes a dynamic smoothing factor for the filter based on the gradient of the price data and the user-defined sensitivity parameter 'k'.
- Gradient:
The gradient represents the rate of change in price, calculated as the absolute difference between the current and previous close prices.
- Sensitivity (k):
The 'k' parameter adjusts how quickly the filter reacts to changes in the gradient. Higher values of 'k' lead to a more responsive filter, while lower values result in smoother outputs.
Usage in the Indicator:
The "close" value refers to the closing price of each period in the chart's time frame
- The indicator calculates the gradient by measuring the absolute difference between the current "close" price and the previous "close" price.
- This gradient represents the strength or magnitude of the price movement within the chosen time frame.
- The "close" value plays a pivotal role in determining the dynamic behavior of the "Dynamic Gradient Filter," as it directly influences the smoothing factor.
What Makes This Special:
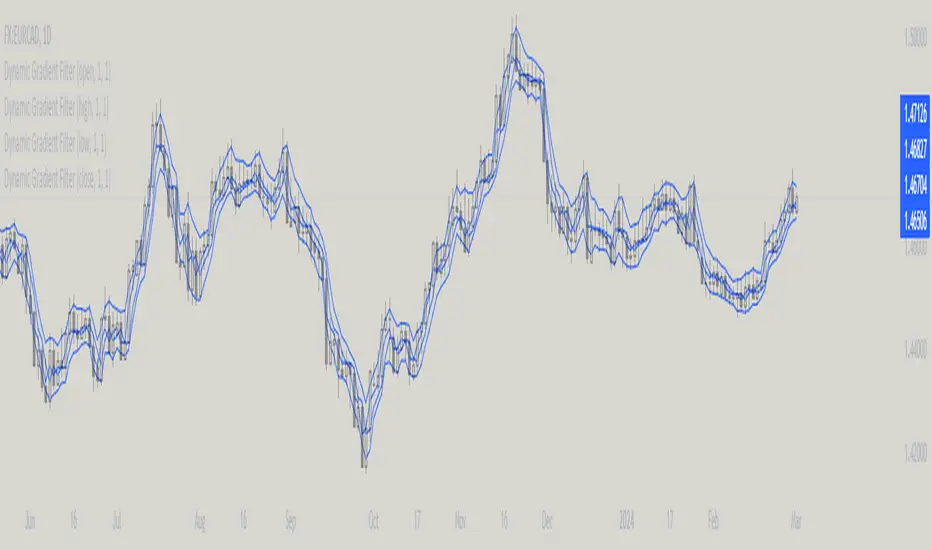
The "Dynamic Gradient Filter" indicator stands out due to its adaptive nature and responsiveness to changing market conditions.
Dynamic Smoothing Factor:
- The indicator's dynamic smoothing factor adjusts in real-time based on the rate of change in price (gradient) and the user-defined sensitivity '(k)' parameter.
- This adaptability allows the filter to respond promptly to both minor fluctuations and significant price movements.
Smoothed Price Action:
- The final output of the filter is a smoothed representation of the price action, aiding traders in identifying trends and potential reversals.
Customizable Sensitivity:
- Traders can adjust the 'Sensitivity' parameter '(k)' to suit their preferred trading style, making the indicator versatile for various strategies.
Visual Clarity:
- The plotted "Dynamic Gradient Filter" line on the chart provides a clear visual guide, enhancing the understanding of market dynamics.
Usage:
Traders and analysts can utilize the "Dynamic Gradient Filter" to:
- Identify trends and reversals in price movements.
- Filter out noise and highlight significant price changes.
- Fine-tune trading strategies by adjusting the sensitivity parameter.
- Enhance visual analysis with a dynamically adjusting filter line on the chart.
Literature:
- https://en.wikipedia.org/wiki/Pierre_Fran%C3%A7ois_Verhulst
- https://medium.com/in-maths-garden-with-julia/behind-the-logistic-function-47a8430a8f46
- https://en.wikipedia.org/wiki/Sigmoid_function
Notes de version
minor adjustment tom = input.float(1, title="Multiplier",minval=0.01, maxval=10000, step=0.01)
Script open-source
Dans l'esprit TradingView, le créateur de ce script l'a rendu open source afin que les traders puissent examiner et vérifier ses fonctionnalités. Bravo à l'auteur! Bien que vous puissiez l'utiliser gratuitement, n'oubliez pas que la republication du code est soumise à nos Règles.
Mupsje aka Casatropical
Clause de non-responsabilité
Les informations et publications ne sont pas destinées à être, et ne constituent pas, des conseils ou recommandations financiers, d'investissement, de trading ou autres fournis ou approuvés par TradingView. Pour en savoir plus, consultez les Conditions d'utilisation.