PROTECTED SOURCE SCRIPT
Mis à jour Dual HTF Candle Boxes with PDH/PDL/PWH/PWL
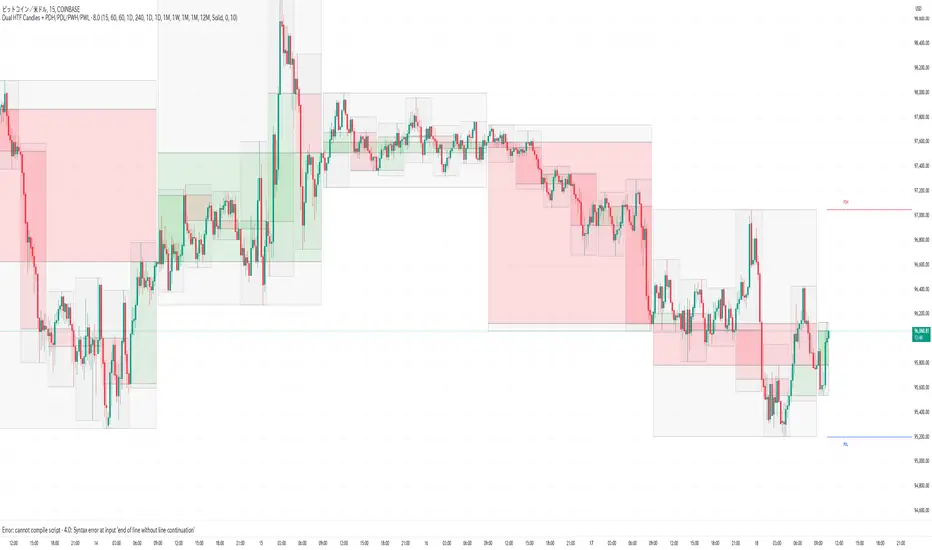
This Pine Script code for TradingView creates an indicator that displays dual higher timeframe (HTF) candle boxes along with Previous Day High (PDH), Previous Day Low (PDL), Previous Week High (PWH), and Previous Week Low (PWL) lines. Let's break down what this code does:
Core Functionality:
Dual HTF Candle Boxes: The script overlays two sets of candle boxes on the main chart, each representing a different higher timeframe. This allows traders to visualize price action on larger timeframes without switching charts. For example, you can see 15-minute and 1-hour candles overlaid on your current chart.
Customizable Timeframes: You can define the specific higher timeframes you want to see for each set of candles. The script provides input options to select these timeframes.
Color Customization: The colors of the candle bodies, wicks, and boxes are customizable. You can set different colors for bullish and bearish candles for each of the two higher timeframes.
Box and Body Display Options: You can choose to display both the box outlines and the candle bodies, or just the bodies, or just the boxes (high/low range). This allows you to customize the visual representation to your liking.
Midline: An optional midline can be displayed within each HTF candle box, representing the midpoint between the high and low.
Range in Pips/Percentage: The script can display the range of each HTF candle in pips or as a percentage of the total range.
PDH/PDL/PWH/PWL Lines: The script also plots horizontal lines representing the Previous Day High, Previous Day Low, Previous Week High, and Previous Week Low. These are common support and resistance levels.
PDH/PDL/PWH/PWL Customization: You can customize the colors and line styles (solid or dashed) of the PDH/PDL/PWH/PWL lines.
Code Breakdown:
indicator(): Defines the script as an indicator with a title and other properties.
input.*: Defines user input options for customizing the indicator. This is how you configure the timeframes, colors, and other settings.
timeframe.period: Gets the current chart's timeframe.
request.security(): Used to request data from higher timeframes. This is how the script gets the high, low, open, and close prices for the HTF candles.
box.new(): Creates the candle box objects on the chart.
line.new(): Creates the PDH/PDL/PWH/PWL lines.
label.new(): Creates the labels for the pip/percentage range and PDH/PDL/PWH/PWL.
array.new_box(), array.new_label(), array.new_line(): These arrays are used to store the created boxes, labels, and lines so they can be managed and deleted if the color settings are changed. This is a crucial improvement for performance and prevents the chart from becoming cluttered with old objects.
f_draw_htf_boxes(): This function handles the drawing of the HTF candle boxes. It takes the timeframe, colors, and other parameters as input.
ta.change(time(Interval)): Detects when a new HTF candle has formed.
Key Improvements in this Version:
Object Management: The use of arrays to store and manage the boxes, labels, and lines is a significant improvement. This prevents the accumulation of objects on the chart, which can slow down TradingView and make the chart unreadable. The script now properly deletes old objects when colors are changed.
Color Change Detection: The script now detects when the user changes the color inputs and clears the existing objects before drawing new ones with the new colors.
Clearer Code Structure: The code is organized into functions, making it easier to read and understand.
How to Use:
Open TradingView.
Open a chart for any symbol.
Open the Pine Editor.
Copy and paste this code into the editor.
Add the indicator to the chart.
Use the input options to customize the indicator to your preferences.
This script provides a powerful way to visualize higher timeframe price action and key support/resistance levels directly on your chart, enhancing your trading analysis. Remember that proper use and interpretation of these indicators are crucial for successful trading. This script is a tool, and like any tool, its effectiveness depends on the user's skill and understanding.
Notes de version
# Dual HTF Candle Boxes with PDH/PDL/PWH/PWL IndicatorThis TradingView indicator visualizes higher timeframe (HTF) candles on the current chart while also displaying important price levels such as Previous Day's High/Low (PDH/PDL) and Previous Week's High/Low (PWH/PWL). It's particularly useful for multi-timeframe analysis.
## Key Features
### Higher Timeframe Visualization
- Displays two different higher timeframes simultaneously
- Shows candle boxes for each higher timeframe
- Option to display full candles (body + wicks) or just high/low boxes
- Color customization for bullish/bearish candles and wicks
### Support for Various Timeframes
- Automatically selects appropriate higher timeframes based on your chart's current timeframe
- Configurable timeframe selection for each base timeframe (1m, 5m, 15m, 1h, 4h, etc.)
### Previous Important Levels
- Shows PDH/PDL (Previous Day's High/Low)
- Shows PWH/PWL (Previous Week's High/Low)
- Customizable line colors and styles
- Adjustable position for both lines and labels
### Customization Options
- Toggle visibility of each component (HTF candles, PDH/PDL, PWH/PWL)
- Customizable colors for all elements
- Options for box style, line width, and display type
- Separate controls for line start position and label position
## Usage
This indicator helps traders:
1. Identify higher timeframe support/resistance levels
2. Understand market structure across multiple timeframes
3. See key reference prices from previous sessions
4. Make more informed trading decisions with multi-timeframe context
The customizable offset parameters for both lines and labels allow for cleaner chart visualization, especially when working with multiple indicators or on densely populated charts.
Script protégé
Ce script est publié en source fermée. Cependant, vous pouvez l'utiliser librement et sans aucune restriction – pour en savoir plus, cliquez ici.
Clause de non-responsabilité
Les informations et publications ne sont pas destinées à être, et ne constituent pas, des conseils ou recommandations financiers, d'investissement, de trading ou autres fournis ou approuvés par TradingView. Pour en savoir plus, consultez les Conditions d'utilisation.