PROTECTED SOURCE SCRIPT
Mis à jour Shifted Lines Based on Hourly Candle
Overview
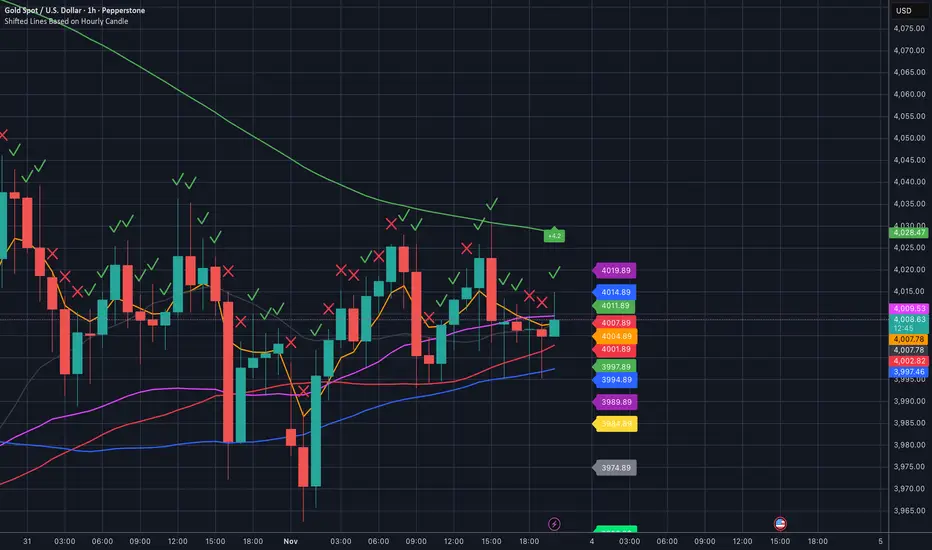
The Shifted Lines Based on Hourly Candle indicator plots two dynamic horizontal lines on your chart, offset by a specified price amount above and below the closing price of the last completed hourly candle. These lines update every hour, providing real-time reference levels that can assist in identifying potential support and resistance zones.
How the Indicator Works
• Hourly Close Reference:
• The indicator uses the closing price of the most recent completed hourly candle as a reference point, regardless of your current chart timeframe.
• Price Offset Calculation:
• You can specify a Price Offset value, which determines how far above and below the hourly close the lines will be drawn.
• Upper Level: Calculated by adding the Price Offset to the hourly closing price.
• Lower Level: Calculated by subtracting the Price Offset from the hourly closing price.
• Dynamic Updates:
• The indicator automatically updates the positions of the lines at the start of each new hour, ensuring they always reflect the latest market data.
Settings and Parameters
Input Parameters
• Price Offset
• Description: The amount (in price units) by which the upper and lower lines are offset from the hourly closing price.
• Type: Numerical input (allows decimal values).
• Default Value: 10.0
• Usage: Adjust this value to set your desired offset distance. For instance, if you set it to 5, the upper line will be drawn 5 units above the hourly close, and the lower line will be 5 units below.
Style Settings
In the indicator’s Style tab, you’ll find the following options:
• Upper Level and Lower Level Lines:
• Color: Default is red. You can change it to any color that suits your preference.
• Line Width: Adjust the thickness of the lines for better visibility.
• Precision: Controls the number of decimal places displayed for the level values. It’s recommended to leave this at the default setting to match the instrument’s standard precision.
• Labels and Values:
• Labels on Price Scale: Enabled by default. This displays the current values of the upper and lower levels directly on the price scale, making them easily visible.
• Values in Status Line: Enabled by default. This shows the values of the levels in the status line at the top of the chart when you hover over the indicator.
Note: The default settings are optimized for general use. You don’t need to adjust them unless you have specific visualization preferences.
How to Use the Indicator
1. Adding the Indicator:
• Since the script is private, you can add it to your chart from the list of indicators you’ve been granted access to.
2. Configuring the Price Offset:
• Open the indicator settings by clicking the gear icon next to its name in the chart.
• In the Inputs tab, adjust the Price Offset to your desired value.
3. Interpreting the Lines:
• Upper Level Line:
• Represents a price level above the last hourly close, offset by your specified amount.
• Can act as a potential resistance level.
• Lower Level Line:
• Represents a price level below the last hourly close, offset by your specified amount.
• Can act as a potential support level.
4. Trading Applications:
• Support and Resistance:
• Use the lines to identify key support and resistance areas for potential entry and exit points.
• Breakout Strategies:
• Monitor price action around these levels to spot possible breakouts or reversals.
• Risk Management:
• Incorporate the levels into your stop-loss or take-profit strategies.
Practical Example
Suppose the last hourly candle closed at a price of 1,500, and your Price Offset is set to 10:
• Upper Level: 1,500 + 10 = 1,510
• Lower Level: 1,500 - 10 = 1,490
These levels will be plotted on your chart and will remain until the next hourly candle closes, at which point they will update based on the new closing price.
Notes and Tips
• Timeframe Flexibility:
• The indicator can be applied to any chart timeframe, but it always references the hourly close for consistency.
• No Need to Adjust Precision:
• The Precision setting in the Style tab is optimized for most instruments and typically doesn’t require changes.
• Visual Customization:
• Feel free to adjust the colors and line styles to integrate seamlessly with your chart’s appearance.
• Indicator Access:
• Since the script is private, only users with access can add it to their charts. The source code remains hidden to protect proprietary logic.
Notes de version
New Features:Multiple Levels:
Now includes three customizable offset levels: Level1, Level2, and Level3, allowing for multiple dynamic horizontal lines based on different dollar values.
Custom Line Styles and Colors:
Users can now select the style (Solid, Dashed, Dotted) and color for each level line, providing greater customization.
Price Labels with Adjustable Offset:
Price labels for each line can now be positioned with an adjustable distance from the right side of the chart for improved clarity.
Updated Overview:
The "Shifted Lines Based on Hourly Candle" indicator plots up to three customizable horizontal lines based on the closing price of the last hourly candle. Each level is offset by a user-defined dollar amount and can be customized in terms of color, line style, and label positioning.
How it Works:
Uses the hourly candle close as a reference.
Plots three offset levels: Level1, Level2, and Level3.
Lines update dynamically at the start of each hour.
New Settings:
Offset Levels: Set custom dollar values for Level1, Level2, and Level3.
Line Style/Color: Customize the style and color for each level.
Label Offset: Adjust the position of the price labels on the price scale.
Use Cases:
Identify potential support and resistance levels.
Use multiple levels to track key price zones for trading strategies.
Notes de version
New Features:Adjustable Line Thickness:
Users can now customize the thickness of each line for Level1, Level2, and Level3. The thickness can be adjusted between 1 and 5, giving better control over the visual prominence of the lines.
Price Label Size Selection:
A new option allows users to select the size of the price labels for the offset lines. Available sizes are Small, Normal, and Large, providing more flexibility in how price levels are displayed.
Refined Price Label Positioning:
The position of price labels has been fine-tuned, ensuring better readability and customizable distance from the right edge of the chart.
Notes de version
Changelog:- Added New Feature: Option to display an arrow above the last closed hourly candle.
- Settings for the Arrow:
- Show Arrow Above Last Hourly Candle: Toggle to enable or disable the display of the arrow.
- Arrow Size: Allows you to set the size of the arrow (Tiny, Small, Normal, Large, Huge).
- Arrow Color: Lets you choose the color of the arrow.
- Arrow Vertical Offset: Adjusts the vertical offset of the arrow from the high of the last hourly candle.
- Feature Description:
- The arrow automatically appears above the high of the most recently closed hourly candle.
- Helps improve chart orientation by visually highlighting the last hourly candle.
- Users can customize the appearance of the arrow according to their preferences.
This update enhances the user experience by providing additional visual tools for chart analysis.
Notes de version
Release NotesNew Features:
1. Multiple Price Levels:
• Added Level2 and Level3 offset lines, complementing the original Level1
• Each level now has independent offset, color, and visibility settings
2. Enhanced Line Customization:
• New line style options: Solid, Dashed, Dotted
• Adjustable line thickness (1-5) for each level
3. Improved Price Labels:
• Customizable price labels for each level
• Label size options: Small, Normal, Large
• Adjustable label offset from the right edge of the chart
4. EMA Integration:
• Added Exponential Moving Average (EMA) plotting
• Customizable EMA settings: length, source, color, and line width
5. Alert System:
• Implemented price alerts based on EMA
• Options for alert timeframe and condition type (Touch, Crosses Above, Crosses Below)
6. Visual Enhancements:
• Option to show/hide close price line
• Arrow indicator above last hourly candle
- Customizable size, color, and vertical offset
7. Increased Flexibility:
• Toggle visibility for individual level lines
• Adjustable backward and forward bar extension for all lines
How to Use:
- Multiple Levels: Utilize Level1, Level2, and Level3 for more comprehensive price analysis
- Line Customization: Adjust style, thickness, and color to match your chart preferences
- EMA and Alerts: Use the EMA for trend analysis and set up custom alerts for price action
- Visual Aids: Leverage the arrow indicator and close price line for improved chart orientation
Notes:
- The new features offer greater flexibility in identifying support, resistance, and trend levels
- Experiment with different combinations of levels and EMA settings to suit your trading strategy
- The alert system can be particularly useful for catching potential breakouts or trend reversals
Notes de version
EMA Touch Indicator:Settings:
EMA Length for Touch Indicator: Allows users to specify the length of the EMA for the touch condition. Default is set to 5.
Touch Condition:
A condition is defined where the price's low is equal to or lower than the EMA, and the high is equal to or greater than the EMA.
Visual Representation:
Plot Symbols:
Displays a green checkmark (✓) above the bar when the touch condition is met.
Displays a red cross (✗) above the bar when the touch condition is not met.
Customizable Display: Symbols are small in size and placed above the bar for easy identification of the condition.
This update introduces a simple and clear visual marker to help traders identify when the price touches the EMA based on the defined conditions.
Notes de version
New Level4 Line:Preset Offset: Level4 is now introduced with a default offset of 15.0.
Customization Options:
Line visibility: You can toggle the visibility for both the upper and lower lines of Level4.
Color: The color for Level4 lines can be set independently, with purple as the default.
Thickness: Adjustable between 1 and 5 for greater control over visual prominence.
Line Style: Supports "Solid", "Dashed", and "Dotted" styles for Level4.
Enhanced Line Customization for All Levels:
User Inputs: Line styles (Solid, Dashed, Dotted) and thickness options (1-5) are now available for Level1, Level2, Level3, and Level4.
Price Labels: Customizable label sizes for each level, with options for Small, Normal, and Large.
Label Positioning: Adjustable label offset, allowing placement flexibility from the right side of the chart.
Hourly Candle Close Line:
Close Price Line: Added an option to display the line for the last hourly candle close price with customizable thickness, style, and color (default: orange).
Automatic Line and Label Updates:
New Hour Detection: The script detects when a new hourly candle forms and automatically removes and re-plots all lines and labels to reflect updated price levels.
Price Label Updates: Labels for Level1, Level2, Level3, and Level4 are dynamically adjusted with each new hourly candle.
This update adds significant functionality with the inclusion of Level4, providing even more flexibility for tracking multiple price levels and enhancing chart customization.
Notes de version
Fixed touch condition logic: Corrected the touch calculation to ensure accurate detection by adjusting the condition reference.Notes de version
• NEW — Close-Open Delta label• A dynamic label now appears on the last bar whenever |Close − Open| ≥ 3 USD (≈ 30 pips on gold).
• It displays the exact move: +X.XX USD (green) or -X.XX USD (red).
• Label height can be tweaked with the new setting “Label vertical offset ” (default = +15 above the candle’s high).
Notes de version
Changelog - Major UpdateEnhanced Multi-Level System
Expanded from 4 to 7 price levels with optimized default values:
Level1: 3.0 (adjusted from original 3.0)
Level2: 7.0 (adjusted from original 6.0)
Level3: 10.0 (adjusted from original 9.0)
Level4: 15.0 (unchanged)
NEW Level5: 20.0 - intermediate resistance/support zone
NEW Level6: 30.0 - extended range analysis
NEW Level7: 50.0 - major breakout/breakdown levels
Complete Feature Parity
All 7 levels now include full functionality:
Individual show/hide toggles for upper and lower lines
Custom color selection with distinct defaults (Level5: Yellow, Level6: Gray, Level7: Lime)
Adjustable line thickness (1-5) for each level
Dynamic price labels with customizable positioning
Consistent line style options (Solid/Dashed/Dotted)
Improved User Experience
Fixed duplicate setting description - corrected "Price Offset for Level3" label to proper "Price Offset for Level4"
Enhanced visual hierarchy with 7 distinct color defaults for better chart readability
Scalable architecture - clean code structure supporting easy future expansions
Technical Improvements
Optimized performance - efficient line management and memory usage across all levels
Consistent behavior - all levels follow identical creation, deletion, and update logic
Maintained compatibility - preserves all existing EMA, alert, and touch indicator functionality
Notes de version
Release NotesNew Features
Added multiple EMA plots with independent toggles:
EMA5, EMA21, EMA50, EMA63, EMA84, EMA200
Each EMA includes an individual line thickness setting
Distinct default colors applied for each EMA line
Changes
Replaced previous single customizable EMA with a fixed set of predefined EMAs (5, 21, 50, 63, 84, 200)
EMA settings no longer use a generic length input; instead, each EMA has its own toggle and thickness control
Unchanged
Multi-level shifted lines (Level1–Level7) with customization (color, thickness, style, labels)
Close price line, alerts, EMA touch indicator, and delta label
Notes de version
# Changelog - Version Update## Moving Average System Changes
### EMA to SMA Conversion
- Changed EMA21, EMA50, EMA63, EMA84, EMA200 calculations to SMA (Simple Moving Average)
- Updated input labels from "EMA" to "SMA" for periods 21, 50, 63, 84, 200
- Changed variable names from `ema21_linewidth` to `sma21_linewidth` (and similar for other periods)
- Modified section title from "EMA SETTINGS" to "MOVING AVERAGES SETTINGS"
### Source Selection Updates
- Renamed `ema_source_option` to `ma_source_option`
- Updated input label from "EMA Source" to "Moving Average Source"
- Changed function name from `get_ema_source()` to `get_ma_source()`
- Updated variable names throughout code to reflect MA instead of EMA naming
## Technical Updates
### Function References
- Updated alert functionality to use `get_ma_source()` instead of `get_ema_source()`
- Fixed variable references in moving average calculations
- Corrected plot statements to match new SMA variable names
### Code Consistency
- Maintained EMA5 as exponential moving average (unchanged)
- Updated all related variable references and function calls
- Preserved all existing functionality while changing calculation methods
## Maintained Features
- All visual customization options preserved
- Alert system functionality unchanged
- Line management and styling options maintained
- Touch indicator and delta label features preserved
Notes de version
✅ Level 7 default value changed: $50 → $45The new default value provides more optimal settings for most trading strategies. The value can be adjusted anytime in the settings.
Script protégé
Ce script est publié en source fermée. Cependant, vous pouvez l'utiliser librement et sans aucune restriction – pour en savoir plus, cliquez ici.
Clause de non-responsabilité
Les informations et publications ne sont pas destinées à être, et ne constituent pas, des conseils ou recommandations financiers, d'investissement, de trading ou autres fournis ou approuvés par TradingView. Pour en savoir plus, consultez les Conditions d'utilisation.