OPEN-SOURCE SCRIPT
TASC 2025.03 A New Solution, Removing Moving Average Lag
█ OVERVIEW
This script implements a novel technique for removing lag from a moving average, as introduced by John Ehlers in the "A New Solution, Removing Moving Average Lag" article featured in the March 2025 edition of TASC's Traders' Tips.
█ CONCEPTS
In his article, Ehlers explains that the average price in a time series represents a statistical estimate for a block of price values, where the estimate is positioned at the block's center on the time axis. In the case of a simple moving average (SMA), the calculation moves the analyzed block along the time axis and computes an average after each new sample. Because the average's position is at the center of each block, the SMA inherently lags behind price changes by half the data length.
As a solution to removing moving average lag, Ehlers proposes a new projected moving average (PMA). The PMA smooths price data while maintaining responsiveness by calculating a projection of the average using the data's linear regression slope.
The slope of linear regression on a block of financial time series data can be expressed as the covariance between prices and sample points divided by the variance of the sample points. Ehlers derives the PMA by adding this slope across half the data length to the SMA, creating a first-order prediction that substantially reduces lag:
PMA = SMA + Slope * Length / 2
In addition, the article includes methods for calculating predictions of the PMA and the slope based on second-order and fourth-order differences. The formulas for these predictions are as follows:
PredictPMA = PMA + 0.5 * (Slope - Slope[2]) * Length
PredictSlope = 1.5 * Slope - 0.5 * Slope[4]
Ehlers suggests that crossings between the predictions and the original values can help traders identify timely buy and sell signals.
█ USAGE
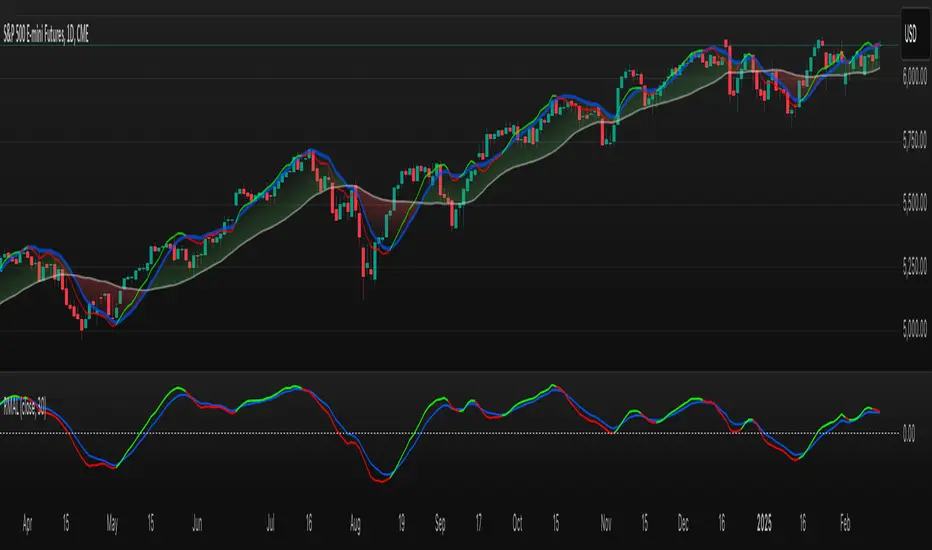
This indicator displays the SMA, PMA, and PMA prediction for a specified series in the main chart pane, and it shows the linear regression slope and prediction in a separate pane. Analyzing the difference between the PMA and SMA can help to identify trends. The differences between PMA or slope and its corresponding prediction can indicate turning points and potential trade opportunities.
The SMA plot uses the chart's foreground color, and the PMA and slope plots are blue by default. The plots of the predictions have a green or red hue to signify direction. Additionally, the indicator fills the space between the SMA and PMA with a green or red color gradient based on their differences:


Users can customize the source series, data length, and plot colors via the inputs in the "Settings/Inputs" tab.
█ NOTES FOR Pine Script® CODERS
The article's code implementation uses a loop to calculate all necessary sums for the slope and SMA calculations. Ported into Pine, the implementation is as follows:
Pine Script®
However, loops in Pine can be computationally expensive, and the above loop's runtime scales directly with the specified length. Fortunately, Pine's built-in functions often eliminate the need for loops. This indicator implements the following function, which simplifies the process by using the ta.linreg() and ta.sma() functions to calculate equivalent slope and SMA values efficiently:
Pine Script®
To learn more about loop elimination in Pine, refer to this section of the User Manual's Profiling and optimization page.
This script implements a novel technique for removing lag from a moving average, as introduced by John Ehlers in the "A New Solution, Removing Moving Average Lag" article featured in the March 2025 edition of TASC's Traders' Tips.
█ CONCEPTS
In his article, Ehlers explains that the average price in a time series represents a statistical estimate for a block of price values, where the estimate is positioned at the block's center on the time axis. In the case of a simple moving average (SMA), the calculation moves the analyzed block along the time axis and computes an average after each new sample. Because the average's position is at the center of each block, the SMA inherently lags behind price changes by half the data length.
As a solution to removing moving average lag, Ehlers proposes a new projected moving average (PMA). The PMA smooths price data while maintaining responsiveness by calculating a projection of the average using the data's linear regression slope.
The slope of linear regression on a block of financial time series data can be expressed as the covariance between prices and sample points divided by the variance of the sample points. Ehlers derives the PMA by adding this slope across half the data length to the SMA, creating a first-order prediction that substantially reduces lag:
PMA = SMA + Slope * Length / 2
In addition, the article includes methods for calculating predictions of the PMA and the slope based on second-order and fourth-order differences. The formulas for these predictions are as follows:
PredictPMA = PMA + 0.5 * (Slope - Slope[2]) * Length
PredictSlope = 1.5 * Slope - 0.5 * Slope[4]
Ehlers suggests that crossings between the predictions and the original values can help traders identify timely buy and sell signals.
█ USAGE
This indicator displays the SMA, PMA, and PMA prediction for a specified series in the main chart pane, and it shows the linear regression slope and prediction in a separate pane. Analyzing the difference between the PMA and SMA can help to identify trends. The differences between PMA or slope and its corresponding prediction can indicate turning points and potential trade opportunities.
The SMA plot uses the chart's foreground color, and the PMA and slope plots are blue by default. The plots of the predictions have a green or red hue to signify direction. Additionally, the indicator fills the space between the SMA and PMA with a green or red color gradient based on their differences:
Users can customize the source series, data length, and plot colors via the inputs in the "Settings/Inputs" tab.
█ NOTES FOR Pine Script® CODERS
The article's code implementation uses a loop to calculate all necessary sums for the slope and SMA calculations. Ported into Pine, the implementation is as follows:
pma(float src, int length) =>
float PMA = 0., float SMA = 0., float Slope = 0.
float Sx = 0.0 , float Sy = 0.0
float Sxx = 0.0 , float Syy = 0.0 , float Sxy = 0.0
for count = 1 to length
float src1 = src[count - 1]
Sx += count
Sy += src[count - 1]
Sxx += count * count
Syy += src1 * src1
Sxy += count * src1
Slope := -(length * Sxy - Sx * Sy) / (length * Sxx - Sx * Sx)
SMA := Sy / length
PMA := SMA + Slope * length / 2
[PMA, SMA, Slope]
However, loops in Pine can be computationally expensive, and the above loop's runtime scales directly with the specified length. Fortunately, Pine's built-in functions often eliminate the need for loops. This indicator implements the following function, which simplifies the process by using the ta.linreg() and ta.sma() functions to calculate equivalent slope and SMA values efficiently:
pma(float src, int length) =>
float Slope = ta.linreg(src, length, 0) - ta.linreg(src, length, 1)
float SMA = ta.sma(src, length)
float PMA = SMA + Slope * length * 0.5
[PMA, SMA, Slope]
To learn more about loop elimination in Pine, refer to this section of the User Manual's Profiling and optimization page.
Script open-source
Dans l'esprit TradingView, le créateur de ce script l'a rendu open source afin que les traders puissent examiner et vérifier ses fonctionnalités. Bravo à l'auteur! Bien que vous puissiez l'utiliser gratuitement, n'oubliez pas que la republication du code est soumise à nos Règles.
Tools and ideas for all Pine coders: tradingview.com/u/PineCoders/
TASC: traders.com/
TASC: traders.com/
Clause de non-responsabilité
Les informations et publications ne sont pas destinées à être, et ne constituent pas, des conseils ou recommandations financiers, d'investissement, de trading ou autres fournis ou approuvés par TradingView. Pour en savoir plus, consultez les Conditions d'utilisation.